Last year I’ve spent quite some time tackling various memory fragmentation issues on an Exadata cluster (I’ve described some of my experiences here and here). In the end, everything was resolved, and the symptoms went away, but only to come back in a different form a few months later. First we had a minor episode months ago — some applications experienced timeouts when trying to connect, and there was a massive spike in Load Average metric with hundreds of processes in the “D” state stuck on rtnetlink_rcv and rtnl_lock. Then everything became stable again, until a few weeks ago, when the same symptoms came back, but the impact became much more severe, with node evictions, reboots and failovers causing serious disruption for the application.

The symptoms listed above are telltale signs of memory fragmentation:
- something causes depletion higher order chunks
- a process acquires a lock (an OS one, not a database one), attempts a higher order allocation which fails, and goes into direct compaction (tries to move around enough memory to create a chunk it needs)
- other processes request the resource locked by the holder and get stuck in the “D” state, with wchan often directly pointing to the name of the lock requested.

Thanks to the experience accumulated last year, the initial diagnosis was very quick — we had some convenient web tools in place that would allow to see the breakdown of processes by wchan with just a few clicks, and some monitoring that periodically collected data on free higher order chunks.
However, saying “it’s fragmentation” was the easy part, finding an actual solution was a bit harder. But we got off to a promising start after trying an old workaround for all sorts of memory fragmentation issues, namely dropping caches
sync; echo 3 > /proc/sys/vm/drop_caches
and finding that it worked (initially we also did manual compactions, but soon abandoned this practice as it was taking too much time and was harder to automate with cron).
Since our symptoms matched bug 30625131 (ASM instances hang up with D status processes) exactly, we also followed the steps in this article under the supervision of Oracle support, but that made little difference. Memory fragmentation issues can be very variable in terms of symptoms, and simply seeing the same kind of locking as someone else doesn’t really mean that the fragmentation itself was coming from the same source, and finding the source is the only thing that can give you the actual permanent solution rather than a temporary relief.
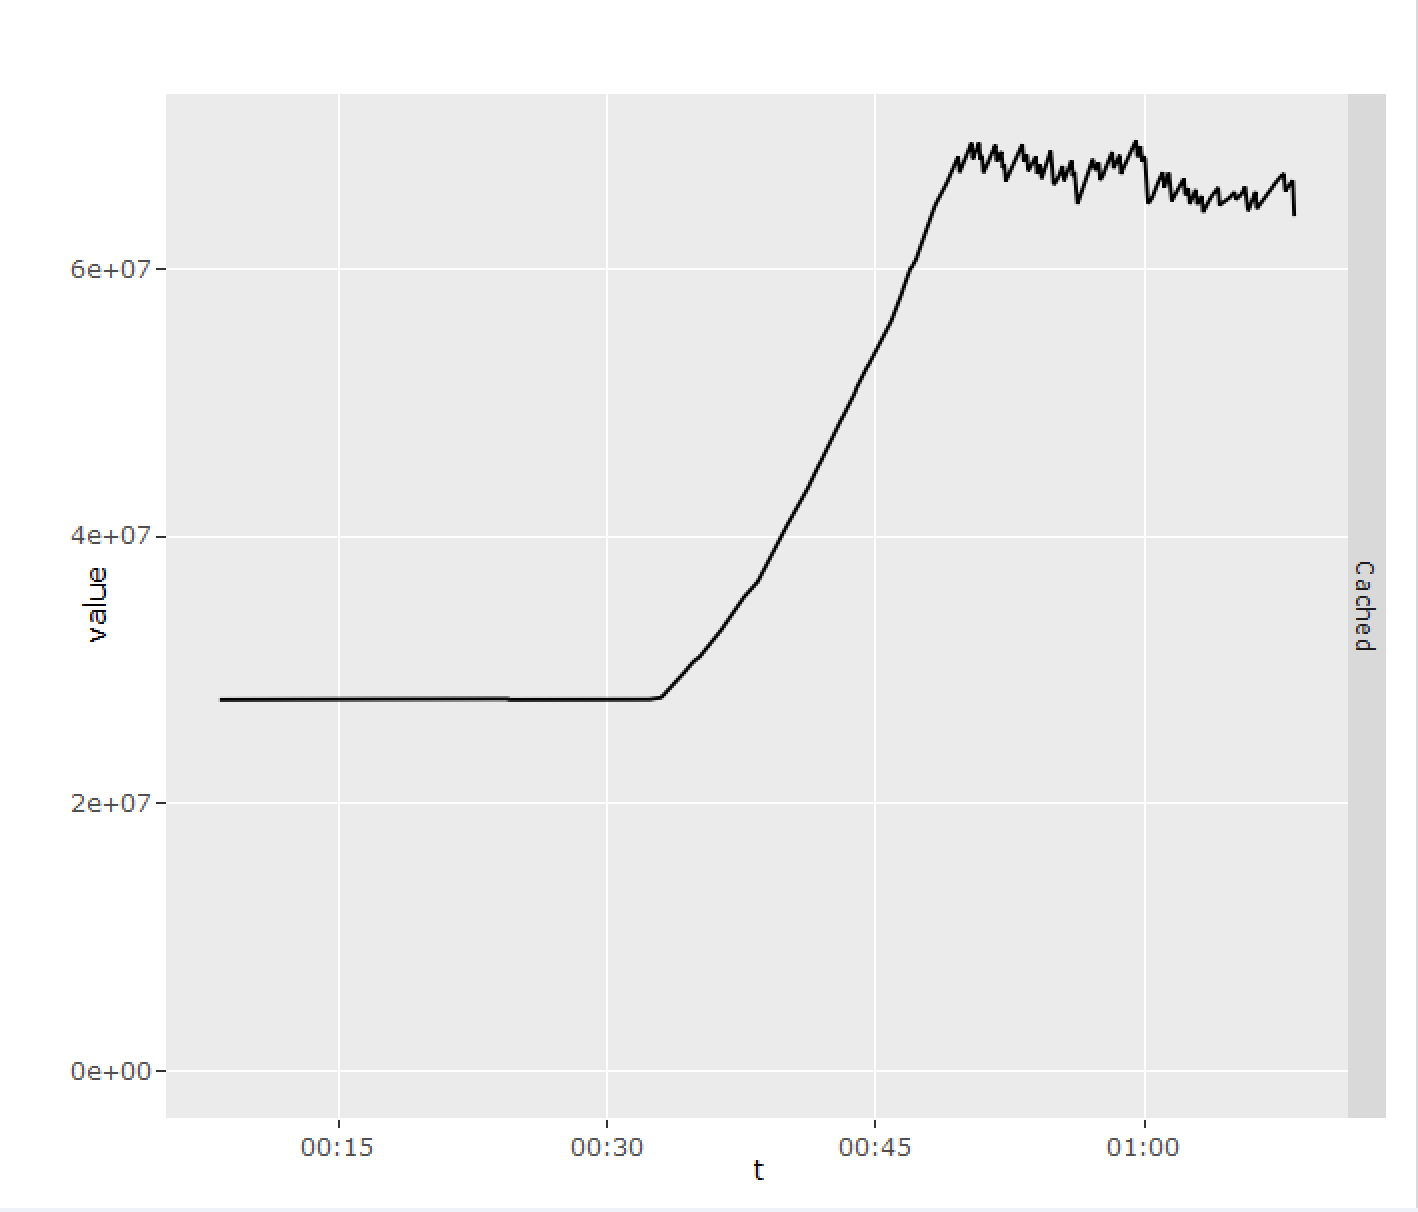
As a first step, I looked at memory usage by various processes using ExaWatcher.ps, but nothing obvious stood out. Then I looked at ExaWatcher.Meminfo, and found something interesting: there was a rapid growth in page cache size (“Cached” metric) within the same time frame. Moreover, when I did the math and converted chunks into gigabytes, I found that the size of the increase matched the amount of memory in higher-order chunks that was lost.
The next logical question became what was causing the page cache growth. Since its purpose was to facilitate disk I/O, I looked at ExaWatcher.Iostat to see for any matching bumps there, but didn’t find anything.
Then the investigation got stalled for a short while. I asked for help on my Twitter, and got some interesting responses, of which unfortunately none could be used as a direct solution. A popular recommendation, however, was to try the cachestat tool by Brendan Gregg. The tool itself wasn’t doing exactly what I needed to do, but when reading about it I saw a couple of interesting perf probe mentioned, and I decided to try them out.
After some trial and error, here is the probe that gave the answer:
sudo perf probe --add add_to_page_cache_lru
sudo perf record -a -g -e probe:add_to_page_cache_lru sleep 10
and this is the stacks that the probe revealed:
dsmc 109577 [043] 826585.017017: probe:add_to_page_cache_lru: (ffffffff811891d0)
    7fff8118b1d1 add_to_page_cache_lru ([kernel.kallsyms])
    7fffa00c6baa ext4_readpages ([kernel.kallsyms])
    7fff811983e7 __do_page_cache_readahead ([kernel.kallsyms])
    7fff8119853f ondemand_readahead ([kernel.kallsyms])
    7fff81198748 page_cache_async_readahead ([kernel.kallsyms])
    7fff8118c0ac generic_file_read_iter ([kernel.kallsyms])
    7fff81206dd1 __vfs_read ([kernel.kallsyms])
    7fff8120743a vfs_read ([kernel.kallsyms])
    7fff812082f6 sys_read ([kernel.kallsyms])
    7fff816b361e system_call_fastpath ([kernel.kallsyms])
            e82d [unknown] (/lib64/libpthread-2.12.so)
There are several potentially useful pieces of information here:
- The command and pid of the process responsible (dsmc is a child process for TSM backup)
- Pages were added to the page cache due to disk I/O (something that was a reasonable assumption straight away, but also something that I started to doubt when I failed to find anything in iostat)
- The I/O in question was reading, not writing
- Read-ahead optimisation was involved.
From TSM logs, I knew that it was spending most of the time doing the backup of the root file system. Some of the things in there, however, hardly made any sense: incremental backup of a 40 GB big file system was taking over 3 hours (!) and generated over 270 GB of traffic (!!). To find out more, the verbose option for TSM was switched on, and soon I had the detailed log which showed that 270 GB of traffic came from… backing up a single file! The file was
/var/log/lastlog
and ls -l command showed that its size was 273 GB. As it turned out, the actual size was just a few kilobytes, but it was a special kind of file, a sparse one, which can fool many programs into thinking that it’s much bigger than it actually is.
TSM is one of the tools that doesn’t handle sparse files properly, which explained the abnormal amount of traffic, and also the fact that the I/O was buffered (as normally TSM should be capable of doing direct I/O preventing the page cache from getting trashed). In fact, this behaviour is well known so TSM backup policy was originally set up to exclude this file together with some other targets, but at some point something happened and the policy went missing, causing TSM to rely solely on IncExc files on the client sides which didn’t contain the exception for lastlog.
As soon as the backup team sorted out the issues with TSM back, the nightly memory fragmentation issues stopped. There remained, however, a second, less destructive scenario of memory fragmentation, but I’m hoping to be able to describe it in a separate blog post some time soon.

Hi,
which web tool are you using for visualizing exawatcher data?
Best regards,
Martin
Hi Martin,
it’s a simple web app written in R shiny.
Best regards,
Nikolai