In my last post, where I analyzed the problems caused by memory fragmentation on a Linux server, I said very little about memory fragmentation itself. I wanted to tell a story, so I had to dial down the technical stuff. But now that the story is told, I figured I should make a more technical post on the subject. I think it might be useful for many Linux DBAs or SAs, since there is not enough awareness of this problem within the Linux community. So if your system is experiencing cryptic performance and stability issues, keep reading, your problem may well be stemming from memory fragmentation.
Some basic definitions
Virtual memory (VM) — Linux is using Virtual memory to go beyond the actual physical capacity (using swap partition) and to make sharing of memory between processes more simple, safe and secure. Physical memory addresses are mapped to virtual addresses, which means that virtual memory can “hide” memory fragmentation and produce a contiguous range of virtual addresses without physically moving the contents of the memory pages
Page is a unit of virtual memory (4kB)
Physical memory — while user space allocations can only use the virtual memory, kernel allocations may still require on contiguous chunks of physical memory
Zone is the way physical memory is organized due to limited ability of some devices to access the address space. For 64-bit architecture, there’s a small DMA zone, and then the rest falls on DMA32 (basically, the first 4GB) and the normal zone (everything else). On a NUMA system, each NUMA node will have such zones.
Buddy allocator is a system designed to tackle some fragmentation issues. Its essence is organizing available pages in powers of 2, ranging from 0 to 10, to make it easier to allocate contiguous chunks and coalesce then back after usage
Allocation order is essentially the binary logarithm of the allocation size in pages. I.e. an order-5 allocation simply means an allocation of size 2^5=32 pages, or 128 kbytes
Page frame reclamation is the process that reclaims pages which are deemed ‘inactive’ by an internal algorithm based on their access patterns
Movable pages are those that can be migrated by changing their virtual-to-physical address mapping
Memory fragmentation is a condition when higher order allocations are bound to fail because there are no contiguous chunks of memory available of the necessary size
Compaction the process of reversing physical memory fragmentation (more about that below)
Direct reclaim/compaction is the situation when a process has to stop whatever it was doing and attempt to reclaim or compact memory itself to satisfy its allocation which cannot be done by any other means. Can be very slow, causing massive performance issues
Mechanics
Memory fragmentation is a condition when the system is running low on physically contiguous chunks, which makes impossible physically contiguous allocations required by some device drivers and other kernel functions.
Compaction is a method of reversing memory fragmentation. It is done on a zone-by-zone basis, and is implemented by using two scanners moving towards each other from the opposite ends of a zone, the migration one and the free one. The migration scanner is looking for movable pages, and the free scanner is looking for page frames where they can be moved to. Zone compaction completes when the two scanners meet somewhere in the middle.
Zone compaction is done by kswapd daemon in older version of the kernel, or by dedicated kcompactd daemon in the newer ones.
As noted above, it is also possible for processes do attempt compaction in a synchronous way (direct compaction). In this case, the compaction will end early, as soon as necessary contiguous space in memory has been created.
Performance impact
The effect of fragmenation is similar to running out of memory in general: page allocation start to fail. The main difference is that not all allocations need physically contiguous chunks, so not all of them will be failing. But other than that, the consequences are similar: failed allocations can cause page reclamation (including swapping), or compaction (defragmentation).
In severe cases, direct reclaim or compaction are possible — i.e. the process can stall while trying to produce the contiguous chunks it needs. The problem can become particularly bad when either large numbers of processes are attempting high order allocations at once, or when a process attempting an allocation is holding a lock that might be needed by a large number of processes. If direct allocations are slow or unsuccesful at all, the problem can easily escalate to OOM process killings, node evictions (when on a cluster).
Diagnosis
Symptoms of memory fragmentation include high sys CPU, or spikes in load average with processes in “D” state, or swapping (e.g. in vmstat).
Since the symptoms can be very diverse, so it is generally not possible to diagnose memory fragmentation from symptoms alone. You can measure fragmentation directly by looking at /proc/buddyinfo which will tell you how many free chunks are available on each zone of each NUMA node per each order. You can do a little math and calculate what percentage of free memory is available for allocations of a certain order. But it’s hard to define specific thresholds.
For example, if you see 0s for orders 8, 9 and 10 in /proc/buddyinfo, then order 8 allocations are bound to fail, that much is clear. But whether or not your system depends on order 8 allocations, is not. In my (admittedly limited) experience dealing with such issues, when fragmentation goes down as low as order 4, problems become overwhelmingly likely. With orders 5-6, they are possible — for example, Infiniband drivers can rely on 256k (order 6) allocations in some cases, and I’ve seen stalled TCP socket buffer allocations of order 5 (based on VM stats). Whether or not allocations of order 7+ are common, I don’t know, all I can say is that for our system they didn’t seem essential, as it was running fine for days with 0s at those values.
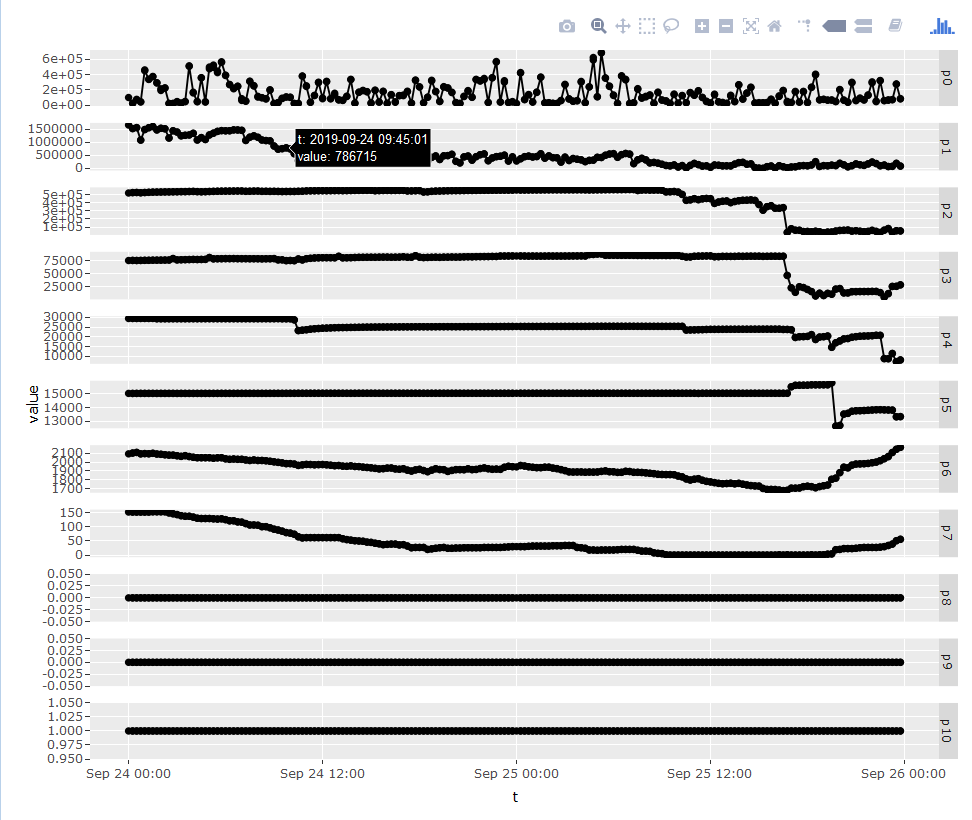
It can also help to visualize the time dynamics of buddyinfo contents to see how quickly fragmentation is occurring, whether or not it is interspersed with periods of recovery from successful compactions, and other patterns that might be relevant.
The only way to confirm the impact of memory fragmentation on system’s performance is by observing compaction-related kernel stacks by one of available stack sampling techniques. When your problem is compaction, you will see something like this:
rmap_walk+0xd8/0x340
remove_migration_ptes+0x40/0x50
migrate_pages+0x3ec/0x890
compact_zone+0x32d/0x9a0
compact_zone_order+0x6d/0x90
try_to_compact_pages+0x102/0x270
__alloc_pages_direct_compact+0x46/0x100
__alloc_pages_nodemask+0x74b/0xaa0
alloc_kmem_pages_node+0x5f/0x120
kmalloc_large_node+0x2e/0x70
__kmalloc_node_track_caller+0x2a5/0x3a0
__kmalloc_reserve.isra.28+0x31/0x90
__alloc_skb+0x7a/0x1f0
sk_stream_alloc_skb+0x3d/0x110
tcp_sendmsg+0x7c3/0xb50 [ksplice_66pn1oi6_vmlinux_new]
inet_sendmsg+0x6b/0xb0
sock_sendmsg+0x43/0x50
sock_write_iter+0x7b/0xe0
__vfs_write+0xb8/0x110
vfs_write+0xa9/0x1b0
SyS_write+0x46/0xb0
_orig_write+0x1bd/0x290 [krg_12_0_0_6017_imOL6UK9K0smp64]
syscall_wrappers_generic_flow_with_param+0x20d/0x730 [krg_12_0_0_6017_imOL6UK9K0smp64]
syscall_wrappers_generic_write.clone.0+0xd6/0x170 [krg_12_0_0_6017_imOL6UK9K0smp64]
SYS_write_common_wrap+0x87/0x140 [krg_12_0_0_6017_imOL6UK9K0smp64]
SYS_write_wrap64+0x1e/0x20 [krg_12_0_0_6017_imOL6UK9K0smp64]
system_call_fastpath+0x18/0xd7
0xffffffffffffffff
Of course when the compaction is affecting performance not directly, but via locking, spotting the problem will become much more difficult. System calls attempting lock acquisition won’t always show up in kernel stacks of affected processes (especially if they are collected by low-overhead sampling techniques), so you won’t always immediately see that it’s a locking issue. And the one process that has the lock and is stuck on compaction, seeing that stack out of hundreds or thousands other stacks won’t be easy.
In some cases, you can examine the source code of the topmost system function: if there is mention of lock acquisition, it can tip you off.
There may be many causes to the fragmentation as to a large extent this is a natural process. But if fragmentation is occurring faster than normal, then looking at VM stats can sometimes give useful clues. For example, you can look at meminfo output (available as part of the ExaWatcher/OsWatcher bundle) to see if anything correlates with the dips in high-order chunks on the buddyinfo graph.

If, for example, you see that step-like increases in Slab metric match the periods of fragmentation getting suddenly worse, then you can further examine slabinfo (also available as a part of the ExaWatcher/OsWatcher bundle) to see which objects within it were responsible.
If the problem seems to be with slow or failing compactions, you can try to obtain additional diagnostic information by examining its kernel stacks (e.g. using flame graphs). The most convenient way to do so is by running compaction manually (see below for details).
In our case, I found that compaction was sometimes extremely slow (timed out after running for an hour). However, the stacks looked normal:
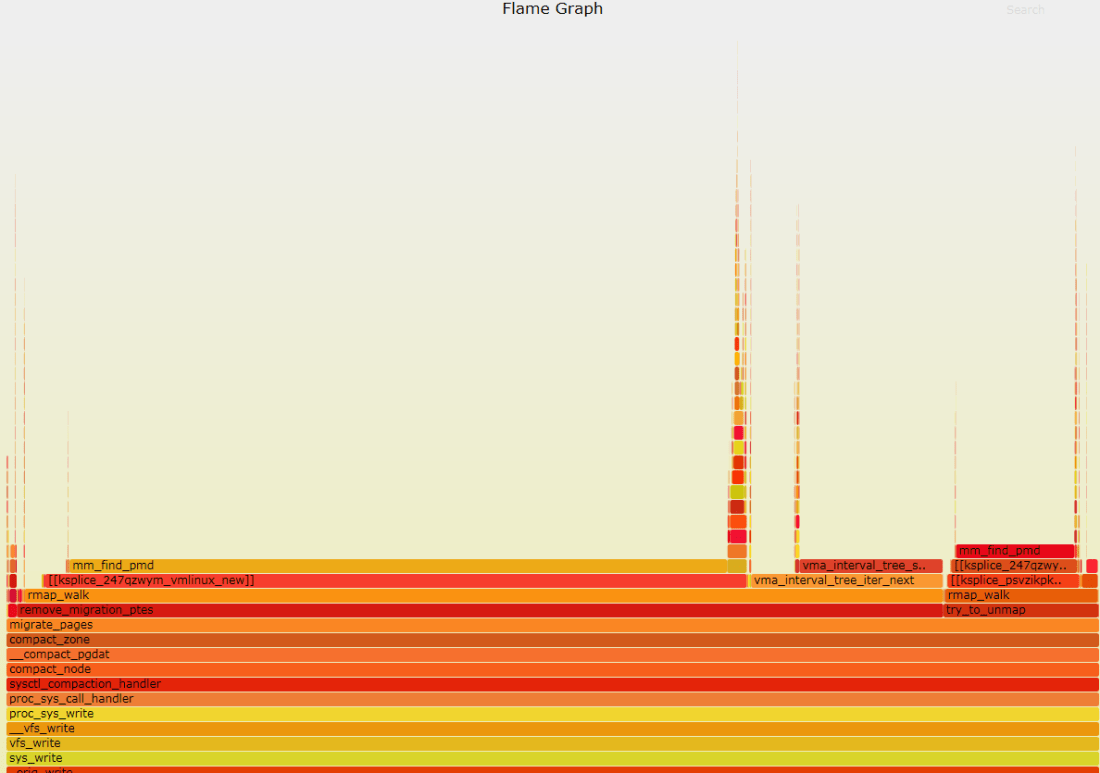
Here it looks as if the compaction spends a lot of time in reverse-object mapping, and not just burning CPU on some spinlock (although this may be the artifact of the way the stacks were collected). There was also some speculation that ksplice may have had something to do with it: ksplice is a Linux utility for applying patches live. Live patching is known to cause performance issues in Oracle, maybe there is something similar in Linux as well.
Remediation
Performance issues due to memory fragmentation have several different levels:
1) there is some activity causing the fragmentation itself, and/or obstructing compaction
2) there is some codepath attempting allocations in contiguous chunks
3) as we have seen before, there may be additional “amplification” via some sort of locking.
To what extent these levels contribute to the problem, how easy each of them is to address — this will vary from case to case.
You can try reverse the effect of memory fragmentation by running compaction manually:
echo 1 > /proc/sys/vm/compact_memory
Of course, doing so on a live production system has its own risks, so I wouldn’t try it before exhausting safer alternatives.
Dropping caches can also help reduce fragmentation. Here is the syntax that will clear the page cache as well as inode and dentry caches:
echo 3 > /proc/sys/vm/drop_caches
or you can try a smaller number to drop caches more selectively (refer to documentation for details). Dropping caches can be expected to have an adverse effect on server performance, so it should only be used if fragmentation problems are severe enough to justify it (testing it first on UAT to get an accurate idea of an impact is highly advisable).
In many cases, memory fragmentation can be reduced by tweaking VM parameters. Of course, as with any low-level change, you really need to know what you are doing, so it’s best to get a consult from a Linux expert, or from Oracle support in an SR (and do some good testing).
One parameter that is probably most relevant to the memory fragmentation, is vm.min_free_kbytes, as it controls the memory reserved for atomic allocations. In our case, it turned out to be undersized (even though this being an engineered system, it was supposed to be set up by the manufacturer). According to Oracle support, when it’s set to too big a value, it can also have a negative impact, so it’s best not to exceed the 5-10% of total memory.
Other parameters that can be relevant are vfs_cache_pressure and swappiness, as they control how the system clears file cache in response to memory pressure, and the balance between reclaim and cache shrinking.
Transparent Huge Pages (THP) can contribute to memory fragmentation as well. This feature is not recommended for us with Oracle databases, so be sure it is off.
If your system is configured to use containers, that can be another major factor. I.e. there can be enough contiguous memory, but it can be not accessible to that particular memory cgroup. Conversely, cgroups can be used to limit fragmentation if it is known which activity is causing it (by isolating this activity to a memory cgroup).
Finally, on NUMA systems, disabling NUMA can make a massive difference. When whatever free memory your system has, is split between several nodes, it becomes much easier to get fragmented.
Summary
Memory fragmentation can be a serious problem for a Linux server, with impacts ranging from mild performance discomfort to node evictions and reboots. It can be identified by examining VM metrics (in particular, /proc/buddyinfo), and confirmed by observing syscalls related to direct compaction in kernel stacks for affected processes. As usual, exact solution will depend on the specific scenario of the problem, but it would typically involve changing VM settings (such as vm.min_kbytes_free) or adjusting memory cgroup configuration. NUMA tends to make fragmentation worse, so if it’s on, disabling it would be one of the first things to consider. While searching for a definitive solution, dropping caches can serve as a temporary workaround, although it may have side effects of its own.

hi,
Thanks for this article.
Question about this: So basically a user process is doing defrag/compact – how does this prevent OTHER processes that need memory from reaping the benefit of the work being done by this user process? Are there any locks put on the defragmented memory to prevent this?
Hi,
not sure if I understood the question correctly but as far as I know there is no mechanism to earmark the compacted memory for any specific process (e.g. the one that is performing the compaction).
Best regards,
Nikolai
Thanks for the response. Yes, you understood the question correctly.
I also went on to read another of your posts after I asked the question: https://savvinov.com/2020/10/14/memory-fragmentation-via-buffered-file-i-o/
you do mention there:
– a process acquires a lock (an OS one, not a database one), attempts a higher order allocation which fails, and goes into direct compaction (tries to move around enough memory to create a chunk it needs)
– other processes request the resource locked by the holder and get stuck in the “D” state, with wchan often directly pointing to the name of the lock requested.
So there DOES seem to be some locking right? I know at some point we just need to “go and read the code” for linux, but just wondering if you know it off the top.
Thanks again.
Hi,
the locking discussed in that other article is not related to the memory pages. It can be any other OS resource. The point is, when a process goes into compaction holding a lock, it can do much more damage and hang lots of other processes. But again, the lock here is not related to the compaction itself.
Best regards,
Nikolay
got it, thanks.
Sorry, question in previosu comment was about this part:
“Direct reclaim/compaction is the situation when a process has to stop whatever it was doing and attempt to reclaim or compact memory itself to satisfy its allocation”
I heard a rumor that if you don’t have any swap, it can’t defragment, or a much?
That doesn’t sound right, but can you elaborate the rumor so I could maybe offer a more complete answer?