Classic symptoms of memory pressure (free physical memory running low + swapping) are often more difficult to interpret than they seem, especially on modern enterprise grade servers. In this article, I attempt to bring some clarity to the issue. It is based on Linux, although many observations can be generalized to other Unix-like operating systems.
Basics definitions
Let’s define some basic terms and concepts:
Page is simply a unit of memory allocation, pretty much like a block in the database world. The standard page size on Linux is 4096 bytes
Huge page is pretty much what the name suggests: it’s a page that is much bigger in size than the normal page (the default on Linux is 2MB). Its purpose is to decrease the overhead on converting logical memory addresses to physical ones. Unlike normal pages, huge pages are static in nature (allocated during startup and not swapped out), with the exception of Transparent Huge Pages (see below)
Transparent Huge Pages (THP) a mechanism for controlling huge pages with minimum interference from the system administrator. THPs can be broken down to normal pages and swapped out, although every effort to avoid doing so is made by the OS. THPs are not compatible with Oracle AMM option and Oracle’s general recommendation is to avoid using THPs on Linux altogether
Page fault is a situation when the Linux kernel is trying to access a memory page, and something doesn’t go quite as planned — either the page is not in the physical memory, or permissions aren’t right, etc. It’s technically an exception, but it’s caught and dealt with on a low level, so it doesn’t really break anything (except in some rare severe cases)
Major (hard) vs minor (soft) fault — to simplify things a little bit, a major fault is one that results in disk I/O. A minor fault is when the page is physically in memory, it’s just that some sort of low lever “paperwork” needs to be done before it can be accessed by the requesting process
Paging is the process of moving pages between the memory and disk (the swap partition), normally happens when there’s some degree of memory pressure. However, Linux tries to be proactive when it comes to swapping, so it can also happen when there is still free memory available
Swapping nowadays is a synonym of paging (at least on Linux). In old times, swapping was referring to a less granular form of memory management when instead of individual pages, the OS would move the entire process space between the memory and disk
Swappiness a numeric parameter controlling how proactive Linux wants to be when it comes to swapping. Not to be messed with (unless you really know what you’re doing)
Paging-out(swapping-out) vs paging-in(swapping-in) the two phases of paging (swapping) activity: moving pages to the disk and back into memory from the disk. From the end user perspective, paging-out just sets the scene for the slowdown, by removing the pages that a process may need later on from the memory. It is the paging-in that follows that makes everything (well, not literally everything — mostly the processes whose pages got swapped out) go slow. A significant amount of time can elapse between the two, explaining why sometimes swapping can be seen with enough free memory present.
Page cache is the part of memory allocated by Linux to speed up I/O operations. Shrinks rapidly when there is memory pressure. Explains why a system may appear to be always to be running low on memory on Linux
NUMA stands for non-uniform memory access. On NUMA systems, memory is broken down into NUMA-nodes, each associated with a group of CPUs which can access it faster. NUMA can hide memory pressure (enough free memory overall, but not enough on some NUMA nodes).
OS system-level tools and metrics
Having sorted the terminology, we can now move on to examining the metrics that help describe memory pressure and tools that expose them.
First, the metrics. What you are primarily interested in when analyzing potential memory pressure, is:
- how much free/used physical memory you have
- what are your memory reserves
- how is free/used memory distributed by page size
- how much memory has been swapped out
- how much swapping (paging) is going on in each direction
- how many processes are running and how many are prevented from running by something.
A few words to clarify the contents of that list.
There is a large number of utilities providing this information in various forms and shapes. What I like to use most is:
-
- free shows free and used memory and the size of the page cache; use -m switch for megabytes or -h for “human-readable” output (i.e. k for kilobytes, M for megabytes and G for gigabytes)
- top (apart from overall and per-process memory metrics, it gives you load average for 1, 5 and 15 minutes)
- sar -B
pulls the information about virtual memory usage from the system archive; majflt/s is the simplest metric it gives you (major faults per second) that is related to paging; pgpgin/pgpgout are confusing because they sound like they are related to paging but apparently they’re not, they are more relevant to the I/O. fault/s includes minor faults and can be useful for analyzing more subtle memory issues, like NUMA balancing. Remaining metrics are for advanced analysis and are beyond the scope of this article - vmstat is probably the best source of information regarding the current degree of memory pressure, as in addition to available/used memory and page cache size, it gives the level of swap activity (so an si — “swap in” and “swap out”), and number of running (“r”) and blocked (“b”) processes. Memory pressure usually shows up as spikes in the “b” metric, as the processes can’t be running on CPU while waiting for the I/O to get their pages in memory to complete, but they can’t go to sleep as when during normal I/O, either.
Vmstat and top output are collected by OS/Exa Watcher utilities, which is very convenient for troubleshooting memory pressure issues that are hard to catch live. Let’s look at an example below:
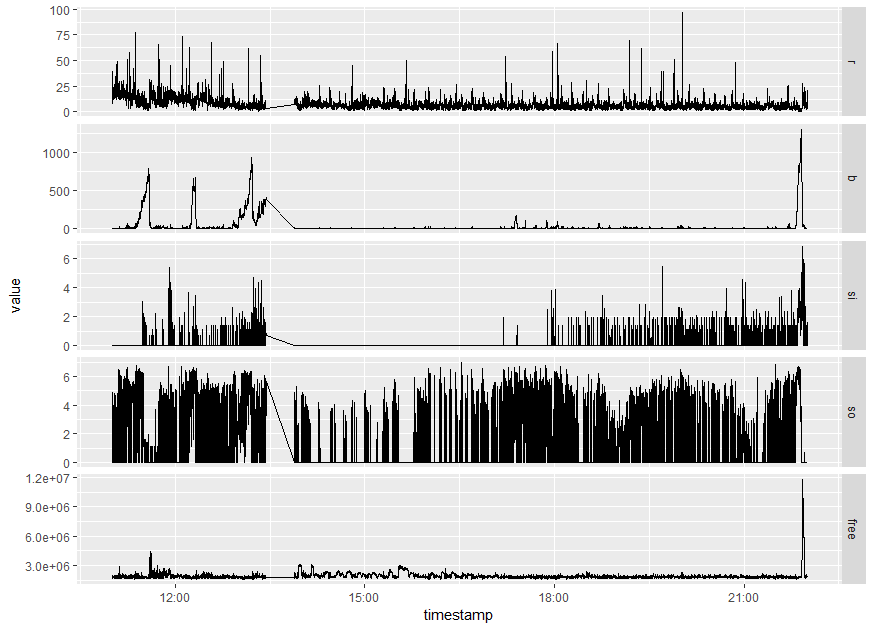
Here you can see contents of vmstat output from ExaWatcher visualized using an R script. For convenience, I plotted si/so metrics to the log scale. You can see spikes of hundreds of processes in the “blocked” state, that correspond to bursts in swapping activity. The relationship between the amount of swapping and the number of “blocked” processes is not linear (there is no reason for it to be), but nevertheless you can see, that when there is no swapping-in, there are no significant spikes in the “b” metric. The same doesn’t hold for swapping-out, as it can have a delayed effect, or no effect at all (if the system made a good guess about whose pages to swap out).
Note that the “free” metric is not particularly helpful here as it doesn’t correlate with anything. This is explained by the reasons mentioned above:
- Linux like to allocate unused space to page cache for I/O buffering, so the system almost always looks like it has less than 1% of free memory
- the amount of free memory is split between hugepages and normal pages, so memory shortage within an individual pool won’t be obvious here.
Of course I can’t claim that every single case of swapping would look exactly like this (or conversely, that anything that looks like this can only possibly be explained by swapping), but generally speaking, when your system looks like this, memory pressure is a fairly safe bet.
If you want to be extra sure, it’s best to compliment this analysis with other metrics, in particular by process-level analysis in the OS and by database metrics (both on system and session level). More on this below.
Process states and wait channels
Swapping occurs on a system level. The processes don’t do the I/O to get their pages back into memory on their own, rather, they rely on the kernel to do so (more specifically, swapping daemon kswapd does much of the job). So while it’s not possible to obtain per-process swap statistics, examining kernel-space process call stacks can help determine whether or not it is affected by swapping at that particular time.
Kernel stacks are often examined using advanced tools such as perf, dtrace or systemtap, but there is also a simpler way by probing /proc//stack pseudofile either manually or via a script .
Of course examining full kernel-space stacks is time consuming when analyzing multiple processes, but fortunately ps exposes the top call as a “WCHAN” (for “wait channel”) column in its output. You can access it using syntax similar to:
ps -eo pid,s,wchan:40,cmd
where the “e” switch is needed to make sure that all processes are shown, while “o” explicitly selects which columns to print. The number after the colon specifies the column length (the default value is too short, which can lead to truncated output and as a consequence, lots of confusion, as I had to learn the hard way).
There is no single value of WCHAN that would tell you that a process is handling a paging fault, so you may have to do a bit of research. If unsure, you can always take samples of full stacks of a few affected processes to understand the meaning of wchan better. In my case, I found wait_on_page_bit_killable and get_request to be associated with bursts of swapping activity. The former showed up in a stack with calls related to handling page faults, so this explicitly confirmed it was related to swapping (with the other one, I didn’t have time to follow up and it wasn’t really necessary at that point).
The great thing about ps is that it is a part of Os/Exa Watcher bundle, so on a RAC environment you can always have access to high-frequency ps snapshots from recent (within retention) past. Using a simple visualization script that I described in my blog you can produce some graphs that will help you get a clear picture of what’s going on.

In addition to WCHAN, ps also provides process states (the “S” column), which is also captured by OS/Exa Watcher scripts, and can also be used for identifying swapping issues. When major page fault is encountered, the process is likely to be in the “D” (“uninterruptible sleep”) state. Same technique as above can of course be used to visualize process states:

Database perspective
Finally, let’s take a quick glimpse at how swapping would show up in database metrics. I took an AWR report from a database under severe memory pressure. I also calculated some averages from ASH for cross-checking.
              Snap Id      Snap Time      Sessions Curs/Sess Instances
            --------- ------------------- -------- --------- ---------
Begin Snap:      6115 25-Jun-19 11:00:28       115       1.2         1
  End Snap:      6116 25-Jun-19 12:00:00       130       1.2         1
   Elapsed:               59.53 (mins)
   DB Time:              172.33 (mins)

             DB Time(s):               2.9              14.7      0.25      0.28
              DB CPU(s):               1.6               7.9      0.13      0.15
      Background CPU(s):               0.0               0.2      0.00      0.00
...

Top 10 Foreground Events by Total Wait Time
~~~~~~~~~~~~~~~~~~~~~~~~~~~~~~~~~~~~~~~~~~~
                                           Total Wait       Avg   % DB Wait
Event                                Waits Time (sec)      Wait   time Class
------------------------------ ----------- ---------- --------- ------ --------
DB CPU                                         5590.5             54.1
resmgr:cpu quantum                     355      448.3 1262.81ms    4.3 Schedule
cell smart table scan              146,739       47.5  323.83us     .5 User I/O
Disk file operations I/O               491         27   55.08ms     .3 User I/O
Disk file Mirror Read                  780       12.8   16.42ms     .1 User I/O
latch: active service list              21       10.4  495.66ms     .1 Other
latch: cache buffers chains             46        8.4  182.38ms     .1 Concurre
latch: shared pool                     104        8.2   78.70ms     .1 Concurre
cell smart index scan               14,418        5.5  382.81us     .1 User I/O
log file sync                          160        5.2   32.44ms     .1 Commit
...


Operating System Statistics      DB/Inst: XXXX/XXXXX Snaps: 6115-6116
-> *TIME statistic values are diffed.
   All others display actual values.  End Value is displayed if different
-> ordered by statistic type (CPU Use, Virtual Memory, Hardware Config), Name

Statistic                                  Value        End Value
------------------------- ---------------------- ----------------
FREE_MEMORY_BYTES                  2,005,082,112    1,780,150,272
INACTIVE_MEMORY_BYTES              5,361,586,176    3,048,497,152
SWAP_FREE_BYTES                   25,764,962,304   25,484,644,352
BUSY_TIME                              4,832,667
IDLE_TIME                             26,135,529
IOWAIT_TIME                            4,620,868
NICE_TIME                                148,823
SYS_TIME                               2,735,804
USER_TIME                              1,903,374
LOAD                                          24               17
RSRC_MGR_CPU_WAIT_TIME                    95,036
VM_IN_BYTES                            3,485,696
VM_OUT_BYTES                         283,803,648
PHYSICAL_MEMORY_BYTES            269,877,653,504
...
So according to ASH, over 90% of the time its active sessions spent in the “On CPU” state. AWR, however, gives a much lower number for DB CPU, just 54% of DB time. This discrepancy is to be expected in case of swapping: AWR only reports actual CPU usage, while ASH labels everything it can’t account for as “On CPU”. Since there is no special wait event for swapping (and there can’t be, because you can’t know in advance that the page you’re requesting is not going to be found in memory — and if you can’t anticipate a wait, you can’t reliably instrument it), sessions waiting swapping end up in this category as well.
The same inconsistency shows in the top wait event section, where barely 60% of DB time is accounted for. Such inconsistencies are to be expected for swapping, but of course they could mean other things, like actual CPU waits. In this case, however, CPU starvation can be ruled out, as the CPU was mostly idle during that time.
The most damning evidence of swapping can be found in the OS stats section, under VM_IN_BYTES and VM_OUT_BYTES. In absence of swapping, these are to be 0.
Swap I/O stats
It’s also worth checking the I/O performance of the swap partition. Obviously, no matter how fast it is, it’s unlikely to be as fast as reading from (and writing to) RAM, but still, if the I/O is particularly bad, it can become an additional factor in the problem. E.g. see the example below:

As you can see here, spikes in read response times reach levels over two order of magnitude above what’s generally considered acceptable even for regular spinning disks, let alone solid state devices. This can explain why sometimes the same amount of swapping can produce worse effect on global server performance.
You can find the physical device for the swap partition using
swapon -s
command, and then use iostat (also available in Exa/OS watcher output) to obtain read/write response times and other useful performance metrics.
Summary
- Free memory is not always a reliable metric for identifying a swapping problem, as the memory pressure can be limited to some subpools (normal pages vs hugepages, NUMA nodes)
- Swap-in and swap-out metrics from vmstat and majflts from sar -B are more reliable, but are most efficient when combined with other metrics
- Process states and “wait channels” exposed by ps provide the most granular level of swapping impact
- On the database level, swapping is causing missing time in AWR reports and high number of active sessions in the “On CPU” state (unmatched by the actual level of CPU usage by the instance)
- Another indicator is non-zero values of VM_IN_BYTES/VM_OUT_BYTES metrics in the AWR report
- Each individual metric can be incorrect or misleading so it’s best to cross-check them against each other to have the full view of the problem
- Poor I/O against the swap partition can aggravate the swapping problem

could you share the data sets you used ? I’d like to play with some visualizations.
Thanks
Kyle
Hi Kyle,
can you DM me on twitter with specifics?
Best regards,
Nikolai
Very useful! Thanks..
Much informative. Are there more ways to track/analyze swap usage at the DB level?
Hi Adamine. Not really, it’s an OS problem and requires OS-level instrumentation. On the database level you are likely to see some slowness that isn’t accounted for by CPU or wait time.