In my last blog post I covered some details of our recent battle with memory fragmentation problems on an OL6 server (Exadata compute node). It was mostly focused around page cache growth which was the main scenario. However, in addition to that, there was also a secondary scenario that had a completely different mechanism, and I will describe it in this post.
To rewind back a little, we experienced fragmentation episodes twice a day for a few weeks. When I say “fragmentation episode”, I mean depletion of higher order chunks and not the symptoms that it caused (connection timeouts, reboots, node evictions etc.). The distinction is important because there can be hours and even days between the moment chunks in a certain order hit zero, and appearance of the symptoms: memory fragmentation only sets the scene for the bad things to happen, but the symptoms may not appear until some allocations with or without additional locking occur.
We could see free higher order chunks going down twice a day: at night, during the TSM backup, and around noon, when apparently something else was happening. Once again, I checked memory usage by processes with ExaWatcher.ps, and found nothing of interest. Then I noticed an interesting difference between nightly and daily episodes: at night, the drops tended to start at lower orders and then spread to higher ones, during the day the higher order would be affected directly, with lower orders either staying intact or even improving.

Once again, I looked at ExaWatcher.Meminfo for further clues. There was nothing interesting happening with page cache around noon, but it was a different story with the SLAB cache:
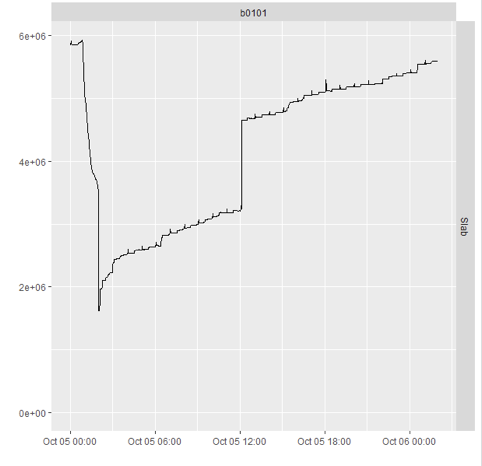
As you can see, SLAB cache would jump up by about a gigabyte (sometimes less, sometimes more) around noon. If we compare it to nightly swings in page cache which measured tens of gigabytes, it doesn’t seem like a lot. But SLAB cache is fundamentally different from page cache because it allocates contiguous memory, and therefore affects higher orders directly.
When page cache was growing, it was trying to use lower orders first. Only when they were all used up (except maybe some reserves), it would go to the next order. With SLAB cache it is a different story, because it would grow by one slab at a time, with a slab having a different number of pages depending on the specific subcache.
To be sure, I did some simple calculations and confirmed that the increase in the SLAB cache was enough to account for the number of higher order chunks disappeared, so it all checked out. That got me closer to the answer, but still, SLAB cache is used by a large number of things, and unless I found out what exactly was causing it to grow, there was little practical use from that knowledge.
I tried to use perf probes on kernel functions related to SLAB allocations but that proved difficult for a number of reasons: it was difficult to find a good probe, too much diagnostic data was being generated, and eventually I also found that memory usage by perf was causing more damage to the problems it was trying to resolve.
ExaWatcher is supposed to have Slabinfo output inside it, but alas, it was disabled for our version (apparently running slabinfo frequently could also contribute to memory fragmentation issues). We scheduled slabinfo to collect information very 15 minutes: enough to get us some insights, and less frequently than ExaWatcher would run it, thus limiting any potential impact. That frequency turned out to be sufficient for us.
========================================================================================
05.10.2020 12:03:01 loncbsob0101 :: Dumping slabinfo
========================================================================================
slabinfo - version: 2.1
# name            <active_objs> <num_objs> <objsize> <objperslab> <pagesperslab> : tunables <limit> <batchcount> <sharedfactor> : slabdata <active_slabs> <num_slabs> <sharedavail>
...
ext4_inode_cache  777130 777200   1120   29    8 : tunables    0    0    0 : slabdata  26800  26800      0
...
========================================================================================
05.10.2020 12:18:01 loncbsob0101 :: Dumping slabinfo
========================================================================================
slabinfo - version: 2.1
# name            <active_objs> <num_objs> <objsize> <objperslab> <pagesperslab> : tunables <limit> <batchcount> <sharedfactor> : slabdata <active_slabs> <num_slabs> <sharedavail>
...
ext4_inode_cache  1866841 1867455   1120   29    8 : tunables    0    0    0 : slabdata  64395  64395      0
...
Slabinfo can contain a lot of output, but with an awk + sort one-liner it’s quite straightforward to find the specific cache responsible for most of the growth, and it turned out to be ext4 inode cache. E.g. in the example above you can see it go up from 0.77M to 1.87M objects, with a single object occurying 1120 bytes.
So it looks like something was looking up 1M+ files on an ext4 file system, which surely sounds like a lot. Then I used df -i command to count used inodes on the server’s filesystems, and before too long I found that data/oracle/XXXXX/admin/ had a million entries (with XXXXX being the database name essentially). I then used find -type f to count actual files recursively and found the specific directory where most of the files were, /data/oracle/XXXXX/admin/diag/rdbms/xxxxx/xxxxx/trace/, most of them in cdmp_xxxxxx subdirectories.
The situation was a result of a combination of factors — some bugs like 29900824 leading to excessive trace file generation, some other trace being generated as expected, but still not carrying useful information (Doc ID 2005854.1), and housekeeping not picking up trace files in subdirectories. The first problem was resolved with a patch. For the second one, the MOS note offered a workaround, using event 10741 to disable the trace generation. And with a few tweaks, the housekeeping started to pick up files in subdirectories. After all of this was done, memory fragmentation finally stopped and higher order chunks remained stable for days.
