It has been (unforgivably) long since my last blog post so let me try and rehabilitate myself by posting a couple of recent interesting investigations. I’ll start with one that combines two of my favourites: stack profiling and “twittershooting” (collective troubleshooting using Twitter as a collaboration tool). The database in question is a 3-node RAC cluster, Oracle version 18.11 being upgraded to 19.10. The problem was detected during the pre-upgrade testing with “compatible” parameter set to 18 (that part was essential for the backout plan in case of major post-upgrade complications). I mention this because for whatever reason, the problem only showed up when the parameter was set.
The problem was that one of the key batch processes became almost twice as slow as on 18c. AWR analysis showed that the slowness was due to “end: KI – contention”, which is some kind of cross-instance locking. Back then, it seemed like the investigation was off to a great start, because the slowness was down to a single kind of a wait event. In such cases, quite often the problem can be resolved by searching MOS for relevant bugs and patches. In our case, however, the search didn’t return any good hits. There was very little information about this type of enqueues, not just in relation to 19c (with or without the compatibility parameter), but in general. And from Active Session History, I knew the parameters associated with this event, p1 (name and mode) and p2 (opcode). But knowing that the enqueue was in a “shared” mode and that the opcode was an integer value of 59 didn’t really tell me much. Equally importantly, ASH didn’t reveal any sql_id’s associated with this wait event, which could have helped to understand what was triggering it.
I asked the community on Twitter and got some helpful responses. For instance, Toon Koppelaars told me that the opcode of 59 meant some “global object invalidation”, although the exact meaning was still not quite clear.
At the same time I decide to try and obtain further clues using stack analysis. In this case tools like perf aren’t applicable because we are interested in off-CPU stacks (when a session is blocked by a wait, the process is taken off CPU), so instead I used short stack dumping via Oracle trace interface:
alter system set events 'wait_event["enq: KI - contention"] trace("%s\n", shortstack())';
<run the load>
alter system set events 'wait_event["enq: KI - contention"] off';
There was no need to build a flame graph since most of the stacks looked the same. I enriched them with Oracle kernel function name decodings using orafun.info, and got the following:
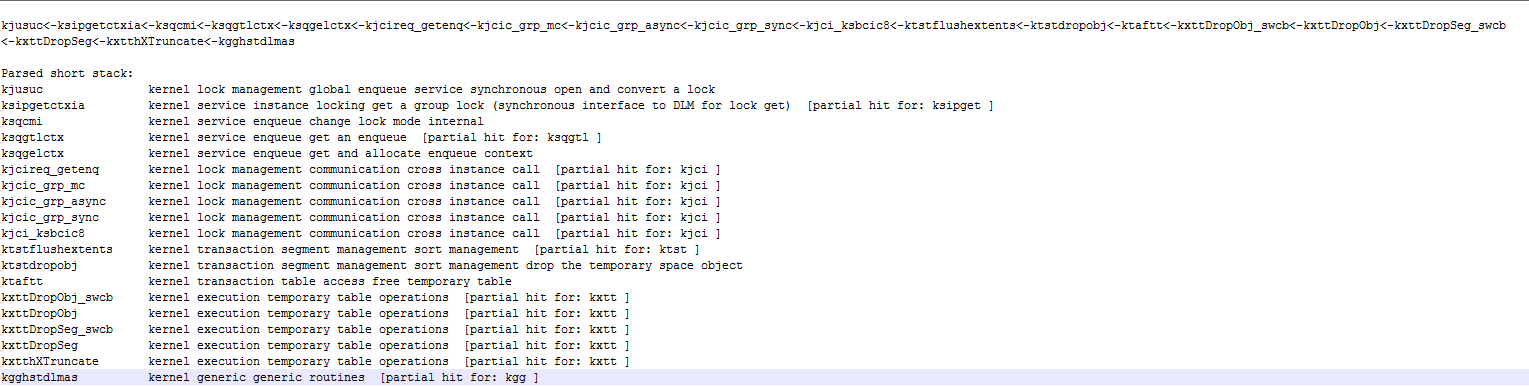
Now things start to make sense — we can see that this is clearly related to temporary tables, and we knew that the batch process was heavily using them, mostly the “ON COMMIT DELETE ROWS” variety. It’s still not clear why truncating rows from a GTT would involve any cross-instance locking, but at this point Jonathan Lewis had joined the discussion and explained that truncating GTTs required flushing dirty points to the disk, even though there is no reason for this to be the case — probably for the reasons of code sharing (i.e. some Oracle kernel developer deciding to re-use permanent table truncate code for GTTs or something like that). Then he further stipulated that somewhere between 18c and 19c Oracle may have decided to make GTT the special case.
One way or another, it looked like running 19c in 18c compatibility mode brought about the worse of both worlds for the internal code handling GTT truncates, leading to poor performance.
At this point the picture became clear enough for other people to similarities with problems they experienced during 19c upgrade, and Anton Spitsyn pointed to bug 33127032 described in MOS note 2798017.1 — ready for download and install for 19.10!
While waiting for the patch to be applied, I simplified the test for the symptoms: the original one was a rather complex batch process requiring a lot of setup and taking a long time to run. With the understanding of what was happening, the issues could have been isolated to a simple insert into an arbitrary GTT with a consecutive commit running in a loop — it didn’t even require multiple concurrent sessions to reproduce the symptoms.
The test provided a confirmation that the patch does indeed solve the issue. So in less then 24 hours, a non-trivial problem was diagnosed, the basic mechanism behind it explained, patch found and applied, and symptoms removed. An impressive result thanks to the power of community and collaboration (and stack trace analysis, of course)!
Some musing about methodology
This investigation started and ended in a MOS search. Could it have been that by spending a little bit more of time and applying a little bit more of effort to the search of the Oracle knowledgebase one could have render all other steps unnecessary? I really don’t think so. The note describing the problem is only a paragraph large, and doesn’t mention the main symptom (KI enqueues) anywhere. It might well be the case that other Oracle customers facing the same issue could have experienced completely different wait events.
What the note does mention is GTTs, but in the start of the investigation nobody would have guessed that GTT had anything to do with the issue, we wouldn’t have known that if it wasn’t for the analysis of the stacks leading to the wait event.
One way to look at this is that Oracle troubleshooting is often a process of obtaining increasingly accurate search terms for the issue to be used in MOS search engine!
Acknowledgements
Much thanks for valuable inputs to the discussion to Frits Hoogland, Jonathan Lewis, Timur Akhmadeev, Anton Spitsyn, Toon Koppelaars, Andi Schoegl, anyone else whose contribution I may have forgotten to mention and many others who helped the discussion by their likes and retweets.

Outstanding post as usual!
But how do you interpret p1,p2,p3 values related to that event ?
There is nothing on MOS related to this event other than the basic doc with no information at all..
Hi Mo,
pNtext parameters give the variable names, so that’s how I found out about opcode = 59. I’m not aware of how this information can be used any further, e.g. how specific operation can be identified from its code. Toon Koppelaars advised me of its meaning in this case but I didn’t ask how he obtained this information.
Best regards,
Nikolai