Call stack profiling and flame graphs have been a hot topic in Oracle tech blogs last few years, and recently I got a chance to use it to troubleshoot an actual production performance issue. It was quite an interesting journey, with some twists and turns along the way. Let me start by presenting some background for the problem.
The database in question (a 3-node Exadata RAC cluster, 11.2.0.4 database version, 18.1.4 Exadata storage software version, Active Data Guard to a remote standby with the same config) had been experiencing performance issues for months. Most of them had to do with the network congestion between the primary and standby, which was causing high log file sync waits while LGWR was stuck on LNS waits (as the Data Guard had to run in Maximum Availability mode).
The network congestion was well understood and a remediation plan was in place, waiting to be implemented some time soon.
But at some point I started realizing that this was not the entire story. I think the first clue might have been massive light-green (“CPU waits”) bands on the OEM graph.

The AWR report also looked a bit odd:
------------ ----------- ------------ -------- --------------- ----------- ---
XXXXXX         891447761 XXXXXX              1 01-Dec-18 15:26 11.2.0.4.0  YES
Host Name        Platform                         CPUs Cores Sockets Memory(GB)
---------------- -------------------------------- ---- ----- ------- ----------

xxxxxxxx0101.uk. Linux x86 64-bit                   88    44       2     251.34

              Snap Id      Snap Time      Sessions Curs/Sess Instances

            --------- ------------------- -------- --------- ---------

Begin Snap:     36858 28-Feb-19 00:00:02     4,527       6.7         3
  End Snap:     36859 28-Feb-19 00:07:07     4,665       6.7         3
   Elapsed:                7.08 (mins)
   DB Time:            1,053.34 (mins)

Load Profile                    Per Second   Per Transaction  Per Exec  Per Call

~~~~~~~~~~~~~~~            ---------------   --------------- --------- ---------
             DB Time(s):             148.7               0.0      0.00      0.01
              DB CPU(s):              28.0               0.0      0.00      0.00
      Redo size (bytes):      28,209,029.9           7,337.1
  Logical read (blocks):       4,876,785.5           1,268.4
          Block changes:         141,796.7              36.9
Physical read (blocks):       2,377,092.1             618.3
Physical write (blocks):          18,462.4               4.8
       Read IO requests:          27,871.9               7.3
      Write IO requests:           8,777.6               2.3
           Read IO (MB):           9,347.2               2.4
          Write IO (MB):             115.8               0.0
RAC GC blocks received:           7,478.6               2.0
   RAC GC blocks served:           4,599.4               1.2
             User calls:          24,567.0               6.4
           Parses (SQL):          10,604.6               2.8
      Hard parses (SQL):              14.1               0.0
     SQL Work Area (MB):             364.7               0.1
                 Logons:              22.9               0.0
         Executes (SQL):          42,351.2              11.0
              Rollbacks:           2,410.3               0.6
           Transactions:           3,844.7

Instance Efficiency Percentages (Target 100%)

~~~~~~~~~~~~~~~~~~~~~~~~~~~~~~~~~~~~~~~~~~~~~

            Buffer Nowait %:   99.88       Redo NoWait %:  100.00
            Buffer  Hit   %:   99.16    In-memory Sort %:  100.00
            Library Hit   %:   99.98        Soft Parse %:   99.87
         Execute to Parse %:   74.96         Latch Hit %:   99.37
Parse CPU to Parse Elapsd %:    8.50     % Non-Parse CPU:   95.90

Top 10 Foreground Events by Total Wait Time

~~~~~~~~~~~~~~~~~~~~~~~~~~~~~~~~~~~~~~~~~~~
                                            Tota    Wait   % DB
Event                                 Waits Time Avg(ms)   time Wait Class

------------------------------ ------------ ---- ------- ------ ----------
DB CPU                                      11.9           18.8
log file sync                       235,376 7964      34   12.6 Commit
cell single block physical rea    4,783,790 1838       0    2.9 User I/O
gc current grant busy               590,247 1170       2    1.9 Cluster
gc buffer busy acquire              705,975 777.       1    1.2 Cluster
library cache: mutex X              318,185 469.       1     .7 Concurrenc
...
It won’t be too difficult to spot at least half a dozen anomalies in this portion of the report (and probably more in the rest), but the most important one is that DB time doesn’t add up to 100%. But if you think about it, it’s not really new information: it’s simply AWR’s way of telling you the same thing that OEM has already told you: the database is spending a lot of time somewhere, and this time is not accounted for by known database waits or time running on CPU. It could be an uninstrumented wait (the database process sleeping while e.g. waiting for some sort of resource occupied by a different process), or wait for the CPU time.
Investigating on the database side
I spent some time trying to see if there was a single source of the activity associated with the missing time: a module, program, user, machine etc., but couldn’t find anything. The only thing that I found that CPU-intensive activities suffered more than I/O intensive ones, but it was impossible to find a clearly defined subset of database activities responsible for most of the missing time.
I also looked at the SQL stats (using DBA_HIST_SQLSTAT view), and managed to find some SQL statements which ran not only during the high load, but also during other times of the day as well (which wasn’t easy, because most of the load was coming from the batch jobs that would only run during those time windows). As expected, all the SQL statements were CPU-intensive. Or rather, “CPU-or-memory intensive”, because it’s impossible to distinguish between the two on the database level.
I checked how their stats evolved throughout the day, and found that most of the metrics stayed consistent even during the peaks. E.g. the amount of logical I/O or rows returned stayed pretty much the same. The only thing that changed, was the appearance of this unaccounted time during the peaks.
These findings were helpful for two reasons: first, the gave me some additional reassurance that I’m chasing an actual problem and not just a weird instrumentation glitch. Second, it suggested ways to reproduce the problem to obtain additional diagnostics.
But trying to reproduce the problem on UAT hasn’t worked — the best I could do was run some SQL in the loop on production and watch its elapsed time per execution inexplicably go up during the peaks. It’s still better than nothing, because it gave me an opportunity to take any measurements I liked against a database process that I could have a complete control over, and which I didn’t care about if it crashed.
When I say “run in a loop”, it’s a bit of a simplification, because I had to do some extra work to make sure that:
1) the SQL statement is actually executing and fetching rows — because if you just run a SQL statement in a PL/SQL block and not use its results for anything, the compiler might eliminate it as a performance optimization
2) make sure that the SQL statement used binds (same as its original prototype) and pick a range of values for the binds so that they wouldn’t be too broad as to generate lots of physical reads, but also wouldn’t be too narrow because then elapsed time per execution stayed constant (this behavior was suggestive that the problem had to do something with the memory, so you need to make sure that the SQL statement would generate some LLC misses and put some pressure on the memory).
CPU metrics
Since database instrumentation couldn’t give the necessary answers, I had to use OS-side instrumentation, and for obvious reasons I stared with static OS-monitoring tools provided by ExaWatcher, trying to determine whether there was actual queuing to get on CPU or something else going on.
One obvious problem with the theory that OEM’s “CPU Waits” are actually CPU waits is that CPU utilization levels aren’t crazy high: just 28 sessions are on the CPU (on the average), with 88 CPU’s available. On the other hand, there are only 44 physical cores, and hyperthreading doesn’t work equally well for all work loads. Besides, there are all sorts of short-lived bursts and/or OS scheduling glitches possible, so it’s still worth checking.
But vmstat and mpstat didn’t reveal anything particularly interesting, either (there was some skew in distributing the load between the CPUs, and with 5-second resolution, CPU utilization looked more jagged than on the OEM graphs, but it didn’t look enough to explain the symptoms.
So I started searching for more direct metrics. On Solaris, time spent waiting for CPU is well instrumented by the OS (and is even exposed in AWR as OS_CPU_WAIT_TIME), but with Linux things are more difficult. In particular, the implementation of load metric in Linux is quite peculiar in that it also includes “uninterruptible sleep”, e.g. due to I/O waits, which makes it much less useful (see here for details).
I couldn’t find any good alternatives in standard Linux performance monitoring tools — looks like the only way to obtain an accurate estimate of this metric was by capturing OS scheduler events with “perf” which can potentially cause a significant overhead on a busy system so it is wise to test it on UAT first (for a comparable load).
With perf, collects scheduler events with
perf sched record
and then display the results using
perf sched latency
which gives per-process output that looks like this:
---------------------------------------------------------------------------------------------------------------
Task | Runtime ms | Switches | Average delay ms | Maximum delay ms | Maximum delay at
---------------------------------------------------------------------------------------------------------------
ksh:206837         | 5008.130 ms | 6 | avg: 0.253 ms | max: 0.356 ms | max at: 17738907.2335
kworker/32:0:13235 | 0.068 ms    | 5 | avg: 0.084 ms | max: 0.406 ms | max at: 17738905.2950
rcuos/35:258       | 0.062 ms    | 1 | avg: 0.056 ms | max: 0.056 ms | max at: 17738904.6058
rcuos/84:601       | 0.057 ms    | 1 | avg: 0.052 ms | max: 0.052 ms | max at: 17738904.4748
ksoftirqd/39:283   | 0.025 ms    | 1 | avg: 0.052 ms | max: 0.052 ms | max at: 17738905.2867
...
Using awk, it’s fairly straighforward to calculate the overall CPU usage and CPU latency, either for all of the processes, or for a subset (e.g. oracle processes only).
I did 3 probes during the busy periods, a few seconds each, and got nothing — no significant CPU scheduling delays (at least, not on the scale indicated by AWR/OEM symptoms).
User-space stack profiling
I’m describing the course of the investigation in roughly chronological order. So at this point I knew that
1) the issue was probably not due to the actual CPU waits (CPU scheduling latency), but rather some sort of uninstrumented wait
2) the issue was not reproducible on UAT, but I could reproduce it in a controlled user session on prod.
Since simpler tools didn’t give any result, it was time to turn to advanced ones. I deciding to do the stack profiling of my session running the “stroboscope” code I described above. Unfortunately I didn’t have any proper profiling tools for my purpose — they either were not available on that platform, or didn’t contain the probes that I needed for off-CPU profiling etc. So I decided to use oradebug short_stack in a loop — it turned out to be good enough. I could even produce flame graphs from the results (the static image below is lacking all the nice interactive features the original svg file would give, but I don’t think wordpress.com would allow me to embed an avg file):
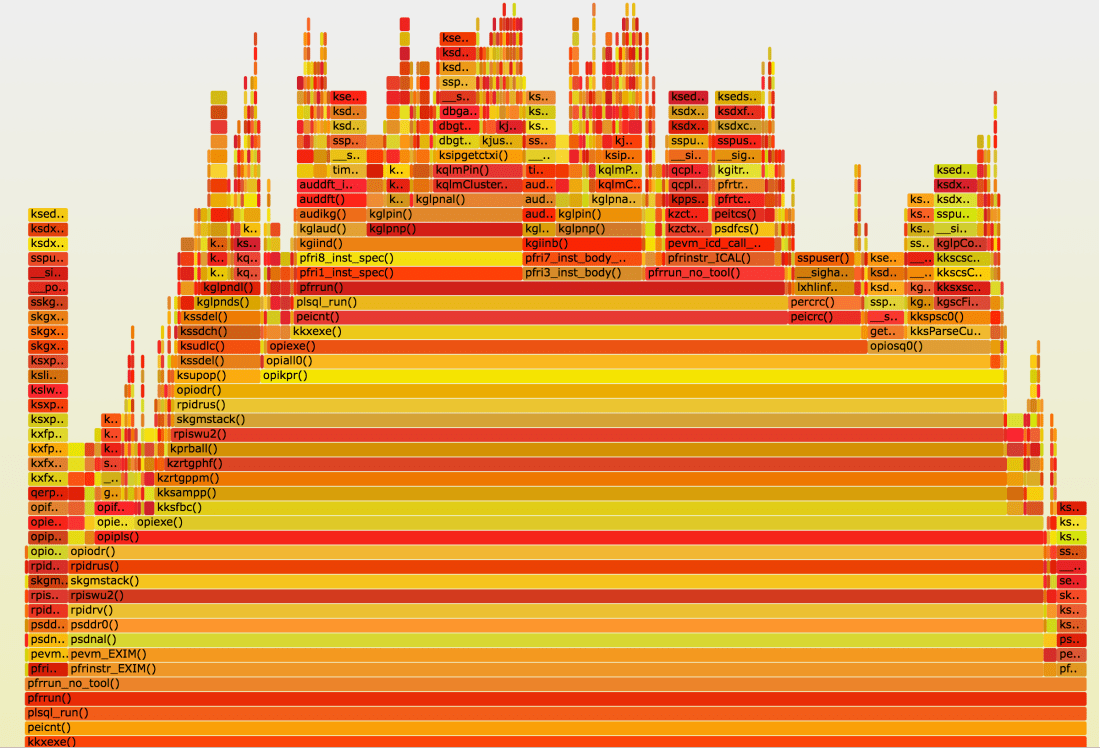
Flame graphs tell you pretty much everything there is to know about where the given process has been spending time. By looking up function prefixes in the ORA-600 lookup tool on my Oracle support (there are also numerous variations of the same on the internet available, e.g. here) you can figure out what each function is doing. So in this particular case you have a broad horizontal stripe with kzrtgppm on it. I don’t know what this function is doing exactly, but KZ is a common prefix for “Kernel Zecurity” functions, and some resources on the web suggest that kzrt have to do with assessing privileges, so it wouldn’t be too big a leap to assume that these calls are VPD-related. Indeed, there is a VPD-policy on the main application table which is queried and modified heavily during the batch jobs in question. If you look at the higher portions of the flame graph, you can also see lots of calls that have to do with statement audit, and/or accessing library cache resources.
This suggested to turn the VPD off and see what would happen, and we did that. The result was somewhat unexpected: the SQL statement that I picked for reproducing the problem indeed ran much faster, and did slow down during the batch job peaks anymore. But everything else did, same as before. So while the flame graph helped us find “a” problem, but not “the” problem. So while initially it looked like this SQL statement that I used in my “stroboscope” was a perfect mirror to study the bigger global issue, apparently, that wasn’t the case.
This meant that I had to do profiling against the actual live processes spawned by the batch job. It was a problem for two reasons: one, in the unlikely event the profiled process would crash as a result of profiling, this could result in a major production incident. And two, the batch job was spawning large number of child jobs which ran for less than a minute, so there was very little time to do the profiling.
Then it has been suggested to me to use hanganalyze and/or system state dump. Both commands dump loads of potentially useful diagnostic information, but most importantly, they also dumped call stacks of database processes. So instead of having a number of call stack snapshots of the same process in time, I would have a snapshot in just one point in time, but of all processes in the system. Reality, however, turned out to be a bit different, because system state dump took almost 10 minutes to complete, so the results were smeared in time (I think the reason it took so long was a large number of inactive sessions which are also processed by this command). Hanganalyze, on the other hand, was much faster, although somewhat annoyingly, many of the stack calls got truncated.
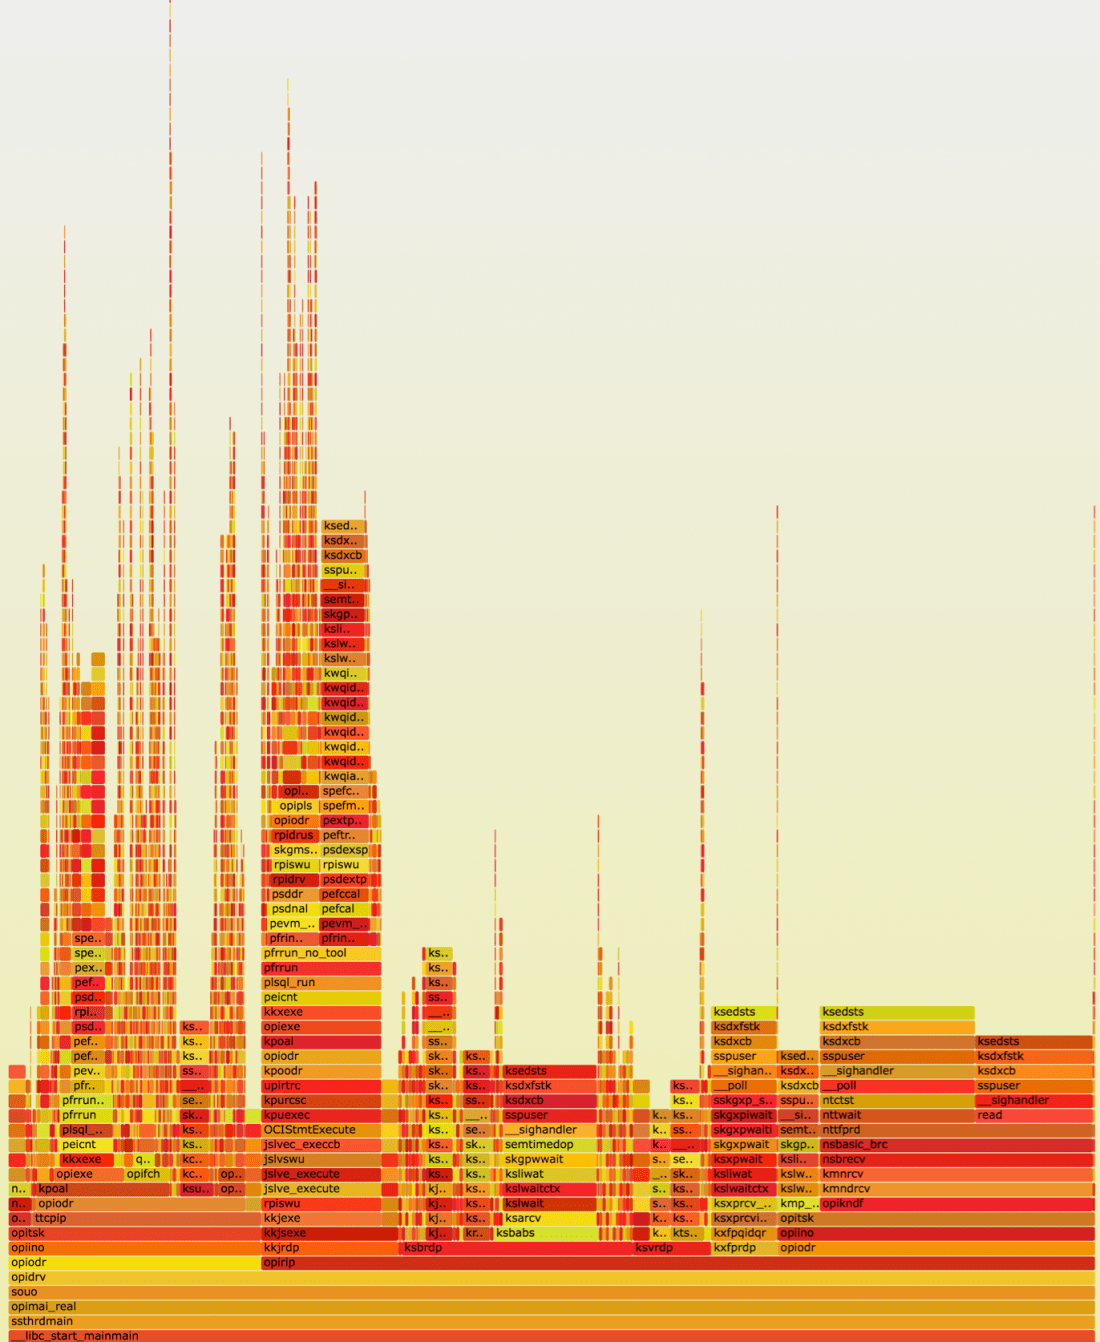
I spent some time analyzing various sections of the graph, but I didn’t find anything out of ordinary — there was a branch that had to do with background processes, another with parallel query processing, one for commits, one for advanced queues — all to be expected there, and a bunch of smaller stuff. Nothing that could shed any light on where 60% of database time disappeared.
This is a good moment to stop and think what I missed. One common problem with call stack profiling in Linux is that there are 4 possible scenarios, depending whether you’re looking at off- or on-CPU time, and whether you are interested in kernel-space or user-space calls, and not all tools are suitable for all these four combinations. System state dump and hanganalyze only give the user-space call stack, so if the problem was due to system calls, they would miss it.
Kernel-space profiling
Finding the proper tool for kernel-space profiling presented same difficulties as for the user-space. Fortunately, there is a lightweight tool that basically probes /proc//stack with low frequency (and therefore minimum overhead and/or risks for the probed process). The next problem was finding the process to sample — previously I was working either with “stroboscope” sessions where my SQL statement was executed in a loop, or with system-wide stack dumps. But I don’t know any tool to dump kernel-space stacks on the system level, and I wasn’t sure if the “stroboscope” was reproducing the global problem correctly.
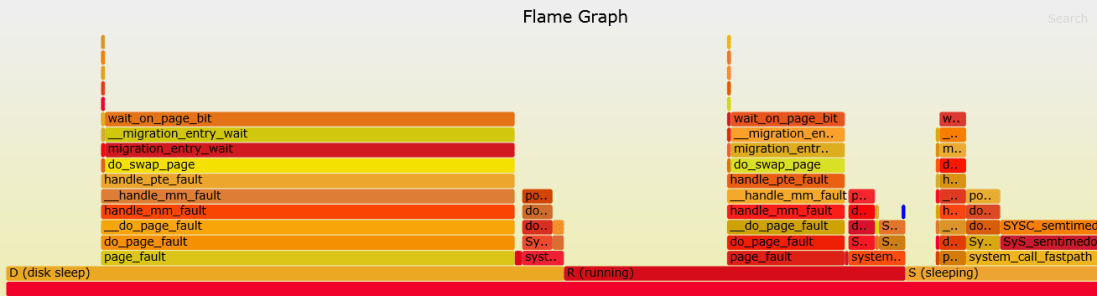
As I mentioned previously, the difficulty for sampling the actual processes spawned by the batch job was (apart from concerns about them being impacted) that they were short-lived, which was making it difficult to catch them. Difficult, but not impossible. On the plus side, if child processes took only a few seconds to complete, that meant that new processes would be spawned all the time, so I wrote a query that returned the server pid of a process corresponding to the batch job’s child job session, logged on during the last 1 second. I would run this query, pass the pid to the SA who then would run the kstacksampler.sh script and send me the output. Same as before, I used the output to produce flame graphs (although for kernel-space it wasn’t really necessary, as the output was relatively simple to read as it was):
Analysis
Now we are finally getting somewhere! We see that most time is spent in the “disk sleep” state, and the remaining time is divided between “running” (i.e. actually running on CPU) and “sleeping” (waiting for stuff). The percentages roughly match light green (“CPU wait”), dark green (“CPU”) and remaining (miscellanous waits, mostly commits and I/O) bands in the OEM graph. So it would seem that our missing time (“CPU waits” according to OEM) corresponds to the processes being in the uninterruptible sleep (“D” state) which is usually (but not necessarily always) associated with disk access. The kernel-space mentions “page faults”, so it looks a lot like paging (or “swapping” in Linux lingo).
However, there was no other evidence to support that — nothing in the OS stats portion of the AWR report, or vmstat ExaWatcher files. Still to be sure, I ran pidstat -v for a few batch job child processes — they showed no major faults, but lots and lots (tens of thousands per second) of minor faults.
Then I looked in kernel source code — the good thing about it is that it’s very well self-documented so the comments contain a lot of useful information:
/*
 * Memory Migration functionality - linux/mm/migrate.c
...

/*
 * Something used the pte of a page under migration. We need to
 * get to the page and wait until migration is finished.
 * When we return from this function the fault will be retried.
 */
void __migration_entry_wait(struct mm_struct *mm, pte_t *ptep,
This tells us that calls to migration_entry_wait have to do with memory migration, which is a done as a part of NUMA balancing. NUMA is non-uniform memory access, which means essentially that memory is split into big chunks (“NUMA nodes”), each associated with a group of CPUs, and accessing memory local to a CPU is faster compared to remote memory.
When a page is migrated, the mapping between the virtual and physical address (the Page Table Entry, or PTE) has to be updated. So, as the commentary to __migration_entry_wait function suggests, we are seeing some sort of memory contention caused by NUMA migrations.
Tracking down the change that triggered the bug
Further research showed that NUMA balancing is known to cause adverse effect on database work loads, and that it could be triggered by upgrading Exadata software to some 12.* and 18.* versions, although the note is not quite consistent as to which minor versions exactly. In our case, it turned out that the Exadata storage software was upgraded to 18.1.4 right be the problem first appeared, so apparently that was what triggered NUMA balancing in our case.
Back when it first happened, the problem went unnoticed for a long time, because as I mentioned in the beginning, the database was experiencing unrelated performance issues (due to network congestions), making it easy to oversee new problems. And then when it did surface a few weeks later, it was misidentified as a side effect of a one-off CPU intensive back-filling script that was running in multiple threads for several days.
The workaround was very simple — just set kernel.numa_balancing to 0 to disable the feature, and it didn’t even require a reboot.
Summary
The key takeaways from this investigation are:
Credits
I’d like to thank Tanel Poder and Luca Canali whose tools made this investigation possible.
Many thanks to John Beresniewicz, Kevin Closson, Jonathan Lewis and others who contributed to a very useful and inspiring discussion on Twitter around various questions that came up during this investigation.
Special thanks to Alexander Anokhin for his insights during many discussions around this issue.

Great detective work!
Nicely documented!
so the fix here was to turn off kernel.NUMA_BALANCING? was that an exadata?
Yes, that’s correct on both counts. However, switching off NUMA balancing makes the system more prone to memory fragmentation, which we learned the hard way several months later after the 18c upgrade as I described here:
https://savvinov.com/2019/10/03/how-to-hang-a-server-with-a-single-ping-and-other-fun-things-we-learned-in-a-18c-upgrade/
https://savvinov.com/2019/10/14/memory-fragmentation-the-silent-performance-killer/
so it’s better to switch NUMA off altogether.