Every upgrade is a bit of a lottery. But for a long running, well established system with a lot of legacy code, it can be more of a Russian roulette. You are unlikely to gain much — your system has been running fine, thanks to various tweaks the apps team applied here and there over the years. All these nice and shiny features that arrive with the upgrade — well, sure, there can be a few that you might like and have big plans for, but most of them are not going to be very useful, at least not out of the box. While there’s a good chance that some of them would backfire in a really, really bad way.
So when facing the task of upgrading one of our 11g databases to 18c, we knew it that it could be challenging. Sure enough, we’ve scheduled several months of UAT testing — but there’ s only so much you can learn from UAT, if it doesn’t have the actual live production workload. Nevertheless, the first warning signs did come from the UAT testing, where we saw some performance problems that were linked to various forms of memory pressure (swapping and compaction stalls due to excessive fragmentation). However, the environment that was exhibiting the symptoms was hosting a large number of databases, and there was a lot of evidence pointing to 18c new features causing higher memory usage, especially when not using PDBs, as was our case. So these issues were written off as the side effects of having multiple non-pluggable databases on a single box. Since the prod environment enjoyed a dedicated cluster, same problems were not expected there.
But the problems didn’t make us wait too long to appear. The very first day after the upgrade, we saw massive performance degradation combined with connectivity problems. Database-side instrumentation (ASH and AWR) wasn’t very helpful, but on the OS side we noticed a high spike in load average.
Load average (LA), by the way, is a very interesting metric. Some people try to use it to get an idea how busy CPUs are, but in Linux it can’t be used for that, as it includes threads that aren’t spinning CPU or waiting for it, but rather are in non-interruptible sleep (the «D» state). But by comparing it to the CPU usage (or simply the number of CPUs on the system, if it goes far beyond that number) you can often spot when something weird is going on. In our case LA exceeded 1,000 on a server with only 44 CPU cores, so it was obvious that something was wrong on a system-level, and that the answer was likely to be found in the OS instrumentation. It also meant that the normal I/O or network latency were unlikely suspects, as processes waiting for network and I/O requests to be completed are normally found in the «S» (normal, i.e. interruptible, sleep) state.
Since we saw similar spikes on UAT when facing memory pressure, it became one of the top suspects straight away. However, there were no signs of swapping, and there seemed to be enough free memory (even without considering caches) when the problem appeared. So we needed to find out more. As I already covered earlier, ps (which is a part of the ExaWatcher package) is very helpful for that purpose. Its output records state «S» and wait channel («WCHAN») of the processes. If you exclude processes in the sleeping state, then the breakdown by wait channel often gives helpful insights as to the root cause of the increase in the load average.
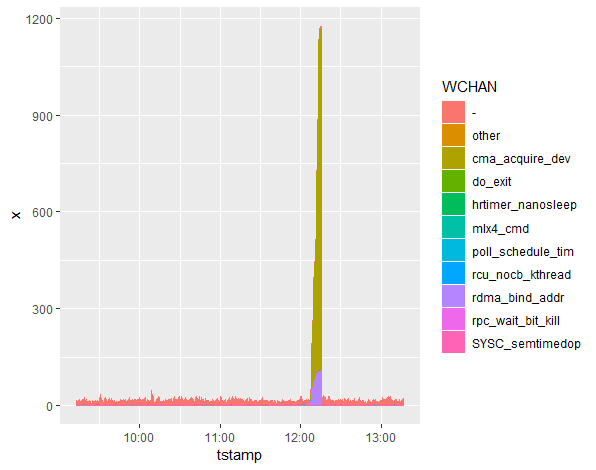
In our case we saw most of the processes in cma_acquire_dev wait channel. This is a very useful piece of information which not only gives you a search term to use in Google or MOS knowledge base, but also allows you to examine the source code directly (since Linux is open source) and get some ideas there. Even the function name itself is a clue — it tells you straight away that it probably has to do with CMA, which stands for Contiguous Memory Allocator.
Combined with history of memory fragmentation issues on UAT, this finding suggests that the problem may have been with the memory fragmentation. As a workaround, we decreased the database SGA, hoping this would help slow down the fragmentation. Also, at a suggestion of one of our DBAs, we looked at vm.min_free_kbytes parameter. Its significance is that it controls an area of memory reserved for atomic allocations. As it turned out, it was undersized by a factor of two. So we corrected that as well.
The effects of the changes were mixed, and the next week connectivity issues, slowdowns, evictions, reboots and other troubles, continued. As before, they were accompanied by spikes in load average, and breakdown by wait channel was pointing to cma_acquire_dev and other system calls associated with RDMA address bindings. I remained suspicious about memory fragmentation, but since there was no other ideas what to do about it at that point, we spent some time exploring other possibilities, in particular around network connectivity (where we knew we did have issues). Terabytes of tcpdumps and client-side and listener-side trace files later, network issues were ruled out as a root cause.
It was only at that time that it occurred to me that NUMA was not doing us any favors, as far as memory fragmentation was concerned. When available memory is split between NUMA nodes, this is likely to make memory more fragmented. Moreover, if the free memory is skewed between the NUMA nodes, then one of them can get much more fragmented than the other real fast, and there’s no guarantee that a process would prefer allocating memory from a remote node over attempting direct compaction or direct reclaim.
So we asked Oracle support for their blessing to switch NUMA off in grub.conf, and as soon as we received it, we did it. And it worked — the symptoms finally went away! But as you can guess, this isn’t the end, as I haven’t yet gotten to the ping part…
Around the time we found the solution, we had two SRs open (two because we erroneously thought that we had two distinct problems), and in one of them, it had been suggested to us that the problem was caused by… rds-ping, a special kind of ping for RDS protocol used in Infiniband. Back then, the idea sounded so absurd that I replied to it with some borderline sarcastic comments (in my defense, we were all pretty tired, and the idea was put forward without a shred of proof… but I still should have known better).
Nevertheless, the idea was surfaced again a few days later, this time with some explanations behind it, and suddenly it looked completely different. They told us that in another customer’s case, they saw rds ping acquire a lock and then go into a compaction stall after failing to allocate the required contiguous chunk of memory. I went back and analyzed ps output from ExaWatcher for the previous outages, and I could see that they were right. During each of our episodes rds-ping was running continuously on CPU for the entire duration of it (sometimes up to 12 minutes!)… and the time frames matched exactly.
So as crazy as it sounds, their theory was correct, and even though it was the memory fragmentation that was the root cause, it was rds-ping acting as a trigger. Unluckily for us, the bug article on MOS was private (or our search for truth would have been much shorter — some 30 minutes to build then wchan graph, and then 5 minutes for the MOS search, and voila!).
Takeaway lessons
- Don’t ever ping anything, or you can hang the server! Just kidding. Nevertheless, when deploying high numbers of frequently polling diagnostic scripts, it helps to remember that sometimes something as innocuous as a ping (even if it’s a special kind of a ping) can have effects as bad as a server reboot. Be reasonable with amount of instrumentation deployed and its probing frequency, and always turn it off when not using anymore
- Many system-wide problems on RACs can be efficiently analyzed via ASH/AWR -> LA -> ps(WCHAN). I.e. start with database metrics. Look at the load in the database. Look at the load in the OS. If you can see inexplicable discrepancies, use ps output to drill down on wchan distribution of the processes.
- Memory fragmentation is a very complex problem in Linux, and it can manifest itself in may different ways — high sys CPU, spikes in Load Average, even swapping. Triggers can also vary a lot (in our case it was rds-ping because it was run by ExaWatcher every few seconds, but the truth is there is a lot of code doing exactly the same dangerous combination of acquiring a lock before attempting a potentially slow allocation, so it could have easily been something else). There is no universal solution for it, so be sure you know the symptoms and the risk factors.

Excellent.
Great post!
1-Let me ask you so numa_balancing which is off by default was not enough by default, so how boot off works differently (I’m sure it is different just not sure how).
2-Also how resistant oracle support was to approve booting numa off?
3-have you encountered “wait_on_page_bit” with this NUMA issue?
Thank you,
Hi Mo,
good questions.
1) We switched numa_balancing off a few months ago (before the upgrade) because it was causing a different kind of performance issues, see https://savvinov.com/2019/04/08/finding-the-root-cause-of-cpu-waits-using-stack-profiling/
Disabling NUMA in grub.conf is a different thing. NUMA balancing makes sure you don’t have a skew between NUMA nodes in terms of free memory or memory fragmentation, but it comes at a very high performance cost (doing lots of page migration to maintain the balance)
2) They weren’t resistant at all — we told them we want to turn it off, they basically told us to go for it
3) It’s complicated. We didn’t see much “wait_on_page_bit” on prod, but we saw lots of it on UAT, which was not very production-like in sense that it was hosting multiple non-PDB databases. However, on UAT, switching NUMA off didn’t see to have a massive impact. On prod it was the opposite — no “wait_on_page_bit” (to be accurate, I think it was “wait_on_page_bit_killable”), but switching NUMA off made all of the differences in the world
may I communicate with you over email? if so what is it?
can you DM me on twitter? my twitter handle is in the “about me” page
I can not dm you as you are not following me
Please try again
Have you seen less CPU and memory usage after the issues were resolved and numa booted off?
Any other remarkable changes other than stalls and crash’s are gone?
We didn’t have issues with excessive memory or CPU usage, our main issues were with connectivity, up to the point of node reboots/evictions. These symptoms went away after disabling NUMA in grub.conf