Loading data from flat files into an Oracle database is a very common task. Oracle’s implementation of external tables is fantastic, and in many cases it simplifies the job to such a degree that the developer is left with very little to do: just write a “create table” statement with a few additional details about the file’s structure and that’s pretty much it. Even if the information in the file is not in a simple format (like comma-separated or tab-delimited), this doesn’t make things much more complicated, as you can e.g. load the raw text and then use regex functions to process it.
So I’ve been using this feature in a broad variety of situations (some of them I covered in this blog, e.g. here), and one problem that I occasionally incur is that performance isn’t always great. For example, here is the DDL of what I use to parse listener log files:
create table listener_log_raw(
    text varchar2(4000),
    lineno number
)
organization external
(
    DEFAULT DIRECTORY listener_log_dir
    ACCESS PARAMETERS (
    RECORDS DELIMITED BY NEWLINE
    NOLOGFILE
    NOBADFILE
    fields terminated by '~'
    (
        text char(4000),
        LINENO RECNUM
    )
    LOCATION ('listener.log')
    REJECT LIMIT UNLIMITED;
);
Now let’s try to parse the contents and load them into another table:
alter session set "_optimizer_gather_stats_on_load" = false;

create table tmp_listener_log
nologging
as
select *
from
(
    select regexp_replace(text, '(\d\d-\w\w\w-\d\d\d\d \d\d:\d\d:\d\d) \* .*\(PROGRAM=([^)^(]*)\).*\(HOST=([^)^(]*)\).*\(USER=([^)^(]*)\).*\(PORT=([^)^(]*)\).* \* establish \* ([^*]+) \* (\d+)', '\1') time,
           regexp_replace(text, '(\d\d-\w\w\w-\d\d\d\d \d\d:\d\d:\d\d) \* .*\(PROGRAM=([^)^(]*)\).*\(HOST=([^)^(]*)\).*\(USER=([^)^(]*)\).*\(PORT=([^)^(]*)\).* \* establish \* ([^*]+) \* (\d+)', '\2') program,
           regexp_replace(text, '(\d\d-\w\w\w-\d\d\d\d \d\d:\d\d:\d\d) \* .*\(PROGRAM=([^)^(]*)\).*\(HOST=([^)^(]*)\).*\(USER=([^)^(]*)\).*\(PORT=([^)^(]*)\).* \* establish \* ([^*]+) \* (\d+)', '\3') host,
           regexp_replace(text, '(\d\d-\w\w\w-\d\d\d\d \d\d:\d\d:\d\d) \* .*\(PROGRAM=([^)^(]*)\).*\(HOST=([^)^(]*)\).*\(USER=([^)^(]*)\).*\(PORT=([^)^(]*)\).* \* establish \* ([^*]+) \* (\d+)', '\3') usr,
           regexp_replace(text, '(\d\d-\w\w\w-\d\d\d\d \d\d:\d\d:\d\d) \* .*\(PROGRAM=([^)^(]*)\).*\(HOST=([^)^(]*)\).*\(USER=([^)^(]*)\).*\(PORT=([^)^(]*)\).* \* establish \* ([^*]+) \* (\d+)', '\4') port,
           regexp_replace(text, '(\d\d-\w\w\w-\d\d\d\d \d\d:\d\d:\d\d) \* .*\(PROGRAM=([^)^(]*)\).*\(HOST=([^)^(]*)\).*\(USER=([^)^(]*)\).*\(PORT=([^)^(]*)\).* \* establish \* ([^*]+) \* (\d+)', '\5') service,
           regexp_replace(text, '(\d\d-\w\w\w-\d\d\d\d \d\d:\d\d:\d\d) \* .*\(PROGRAM=([^)^(]*)\).*\(HOST=([^)^(]*)\).*\(USER=([^)^(]*)\).*\(PORT=([^)^(]*)\).* \* establish \* ([^*]+) \* (\d+)', '\6') code,
           text
    from listener_log_raw
    where /*not regexp_like(text, '\d\d-\w\w\w-\d\d\d\d \d\d:\d\d:\d\d \*.*')
    and */not regexp_like(text, '\d\d\d\d-\d\d-\d\dT\d\d.*')
    and not text like 'Creating new log segment%'
    and not text like '%service_update%'
    and not text like '%COMMAND=%'
    and not text like '%ping%'
);
Mark the ALTER SESSION statement — I need it here because on 18c otherwise I’d end up spending a lot of time gathering optimizer stats while loading data, and that’s not something I want in this case. But even with this parameter off, things aren’t particularly fast:
Global Information
------------------------------
Status              :  DONE
Instance ID         :  1
Session             :  XXXXXXXXXX (409:28572)
SQL ID              :  4sfvsz705u4wf
SQL Execution ID    :  16777218
Execution Started   :  06/07/2020 02:15:23
First Refresh Time  :  06/07/2020 02:15:31
Last Refresh Time   :  06/07/2020 02:19:50
Duration            :  267s
Module/Action       :  SQL Developer/-
Service             :  XXXXXXXXXX
Program             :  SQL Developer
SQL Plan Monitoring Details (Plan Hash Value=2209372733)
===============================================================================================================================================================================
| Id |           Operation           |       Name        |  Rows   | Cost |   Time    | Start  | Execs |   Rows   | Read | Read  | Write | Write | Activity | Activity Detail |
|    |                               |                   | (Estim) |      | Active(s) | Active |       | (Actual) | Reqs | Bytes | Reqs  | Bytes |   (%)    |   (# samples)   |
===============================================================================================================================================================================
|  0 | CREATE TABLE STATEMENT        |                   |         |      |       260 |     +8 |     1 |        2 |      |       |       |       |          |                 |
|  1 |   LOAD AS SELECT              | TMP_LISTENER_LOG  |         |      |       265 |     +3 |     1 |        2 |      |       |   332 | 322MB |          |                 |
|  2 |    EXTERNAL TABLE ACCESS FULL | LISTENER_LOG_RAW  |       1 |  158 |       266 |     +2 |     1 |     583K |  197 |  99MB |       |       |          |                 |
==============================================================================================================================================================================="
Most of the time is spent on the LOAD AS SELECT step on CPU. What’s taking all the CPU? Probably regex processing, but if you’d like to make sure, and have the necessary level of access, you can do this with CPU profiler like perf.
Let’s get the Linux pid of the process
select /*+ 324155 */ spid
from v$process
where addr = (select paddr from v$session where sid=userenv('sid'));
and then use it to collect the data on the OS level:
sudo perf -p 324155 -g sleep 10
That takes full stack (the -g option) samples for the process with pid 324155 for 10 seconds and records the result to perf.data file. Then we can produce a flame graph using scripts from Brendan Gregg’s flame graph bundle:
sudo perf script | stackcollapse-perf.pl | flamegraph.pl > listener.svg
That’s it — now we can open the svg file in a browser (preferably Chrome).
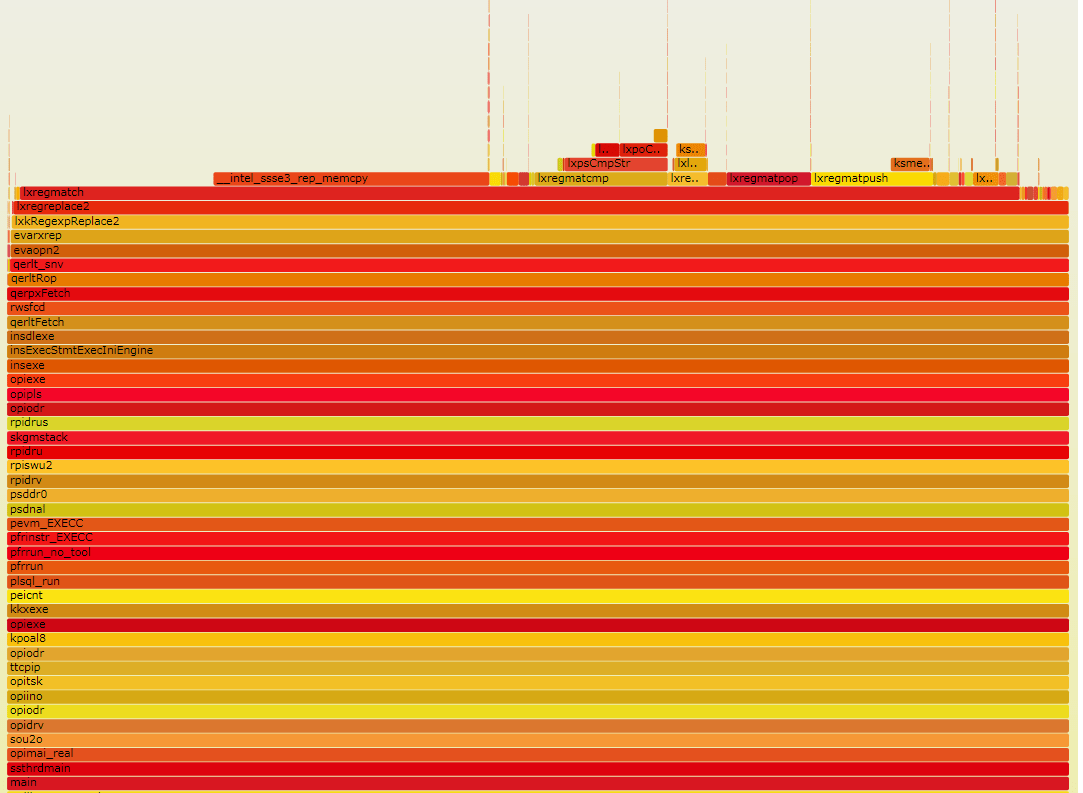
While the internal Oracle functions in this stack aren’t described in the documentation, names like “lxregmatch” are fairly self-explanatory. OK, so as we suspected, it’os the regex stuff that is slow. If we saw something else, like something related to redo generation or extent allocation, we might have done some database tuning, but the regex part is beyond our reach. What can we do then?
I simply offloaded regex parsing to the OS using a python script:
#!/usr/bin/python

import re
import sys

file = open(sys.argv[1], 'rt')

pattern = "(\d\d-\w\w\w-\d\d\d\d \d\d:\d\d:\d\d) \* .*\(PROGRAM=([^)^(]*)\).*\(HOST=([^)^(]*)\).*\(USER=([^)^(]*)\).*\(PORT=([^)^(]*)\).* \* establish \* ([^*]+) \* (\d+)"
for line in file.readlines():
    match = re.search(pattern, line)
    if (match):
        print("%s,%s,%s,%s,%s,%s,%s" % (match.group(1), match.group(2), match.group(3), match.group(4), match.group(5), match.group(6), match.group(7)))
If you don’t like Python, anything else will do — perl, bash etc. One could probably even do a one-liner in sed but I decided not to bother because it would require rewriting the regexp pattern (as sed doesn’t seem to support things like \d for a digit).
Once the regex parsing logic has been moved into the script, the table definition needs to be updated to include the script name as the preprocessor:
create table listener_log_raw(
  text varchar2(4000),
  lineno number
)
organization external
(
  DEFAULT DIRECTORY listener_log_dir
  ACCESS PARAMETERS (
    RECORDS DELIMITED BY NEWLINE
    NOLOGFILE
    NOBADFILE
	preprocessor exedir:'listener_preprocessor.py'
    fields terminated by '~'
    (
        text char(4000),
        LINENO RECNUM
    )
  )
  LOCATION ('listener.log')
)
REJECT LIMIT UNLIMITED;
Loading time went down from 3-4 minutes down to 3-4 seconds.
Update After I published the post, an interesting discussion on Twitter followed. It has been suggested that the improvement might have been accounted to Python extracting all capture groups in one go, unlike Oracle case, when we have a separate projection per each capture group, potentially increasing the amount of work to do.
When trying to optimize things in the Oracle side, I also had a similar theory at some point, and back then I did a quick-and-dirty test which didn’t reveal any significant difference. After this Twitter discussion, I re-checked it, and I can confirm my initial findings. More specifically, if I did exactly the same thing in Oracle that I did in Python, i.e. do
regexp_replace(pattern, '\1,\2,\3,\4,\5,\6,\7')
instead of 7 different regexp_replace expressions, I still get the same performance. Out of curiosity, I ran a test with just one capture group,
regexp_replace(pattern, '\1')
, and here there were no surprises — performance improved roughly proportionally to the decrease in number of capture groups.
There was also feedback from S. Wolicki and Roger MacNicol from Oracle corp. who apparently work on implementation of regex processing in Oracle, and according to them this might be a known problem due to the choice of algorithm. So there is hope this may get fixed some time soon.
