In the previous part of this mini-series we looked at differences in multiblock read behavior for different nested loop optimization mechanisms depending on degree of ordering of the data. In this post I’ll continue to explore the subject, but this time we’ll focus on decision-making process: what factors (other than the obvious ones — like optimizer hints and/or parameters) affect the specific choice of a mechanism?
Clustering factor
Previously, we saw that in all nested loop implementations, how aggressively multiblock reads were used, depended on the clustering factor of the inner table. This suggests to play with the clustering factor without changing the data themselves, and see how this would affect the behavior.
It is fairly straightforward to do this, all we need, is to set the optimizer statistics for the clustering factor using
exec dbms_stats.set_index_stats(user, '&indexname', clstfct=>&newclstfct);
So let’s create a test table (using the same DDL as described in the previous post, with pad=100 and rand=50, i.e. medium row density per block, and with half of the rows randomized), and then switch between two extremes: minimum and maximum possible values of the clustering factor (the number of leaf blocks and the number of rows correspondingly). In order to minimize chances of random anomalies affecting our results, let’s switch the clustering factor back in forth several times like this: min, max, min, max, min, min, max, max, min, min, and repeat this for all three optimization mechanisms (prefetch, batching, batching rowid).
I’ve summarized the results of this exercise in a table, which shows the number of db file sequential reads (SEQ), db file scattered reads (SCAT), db file parallel read (PAR) and direct path read (DIR) in the table below. For brevity, I’m showing only results for the prefetch optimization, as the other two remaining methods show same behavior.
TAG			RAND	 PAD OPT		      SEQ	SCAT	 PAR	 DIR	   MBRC
-------------------- ------- ------- -------------------- ------- ---------- ------- ------- ----------
cf_nflsh5max		  50	 100 prefetch		       34	   0	  25	  23	     20
cf_nflsh5max		  50	 100 prefetch		       34	   0	  25	  23	     20
cf_nflsh5min		  50	 100 prefetch		       34	   0	  25	  23	     20
cf_nflsh5min		  50	 100 prefetch		       34	   0	  25	  23	     20
cf_nflsh5min		  50	 100 prefetch		       34	   0	  25	  23	     20
cf_nflsh5min		  50	 100 prefetch		       34	   0	  25	  23	     20
cf_nflsh5max		  50	 100 prefetch		       34	   0	  25	  23	     20
cf_nflsh5min		  50	 100 prefetch		       34	   0	  25	  23	     20
cf_nflsh5min		  50	 100 prefetch		       34	   0	  25	  23	     20
cf_nflsh5max		  50	 100 prefetch		       34	   0	  25	  23	     20
As we can see, nothing changes — looks like the value of the clustering factor in optimizer statistics is not making any difference. Now let’s do the same experiment again, but this time let’s flush the buffer cache between test runs:
TAG			RAND	 PAD OPT		      SEQ	SCAT	 PAR	 DIR	   MBRC
-------------------- ------- ------- -------------------- ------- ---------- ------- ------- ----------
cluf_flush5min		  50	 100 prefetch		       17	  30	  26	  23	     69
cluf_flush5max		  50	 100 prefetch		       42	   0	  25	  23	     20
cluf_flush5min		  50	 100 prefetch		      460	   0	   0	  23
cluf_flush5max		  50	 100 prefetch		       41	   0	  25	  23	     20
cluf_flush5min		  50	 100 prefetch		      460	   0	   0	  23
cluf_flush5min		  50	 100 prefetch		      460	   0	   0	  23
cluf_flush5max		  50	 100 prefetch		       42	   0	  25	  23	     20
cluf_flush5max		  50	 100 prefetch		       42	   0	  25	  23	     20
cluf_flush5min		  50	 100 prefetch		      460	   0	   0	  23
cluf_flush5min		  50	 100 prefetch		      460	   0	   0	  23
This is a completely different picture! With the exception of one anomalous point (which even shows scattered reads which are hardly to be expected here) we can see multiblock reads come and go exactly as we switch the clustering factor min and max values!
The other two mechanisms, batch and batch rowid, don’t show this behavior. For them flushing the shared pool doesn’t make any difference, multiblock reads are always on the same levels regardless to the value of the clustering factor.
Another thing we can do is construct a table with data, which like before, would contain a mix of ordered and unordered data. Only this time, we’ll arrange it in a step-like fashion: completely ordered data, and then completely unordered data, or vice versa. Obviously, both tables would have very similar clustering factors for their indexes, but the effect could be different, because the nested loop would start with either ordered or unordered data. This way, we could find out if any run-time factors affect the decision-making in choosing a specific implementation for a nested-loop.
So we’ll have two tables: one would contain the first 50,000 rows completely ordered, and the next 50,000 rows completely unordered, the other would contain similar data but in the reverse order. First, let’s check the clustering factors:
select INDEX_NAME, clustering_factor from user_indexes where index_name like '%NLDUAL%';


I$NLDUAL1_RAND50_PAD100$ID	50729
I$NLDUAL2_RAND50_PAD100$ID	50731
As expected, the clustering factors are nearly identical.
Now let’s run the tests and see at the results. Case 1, ordered then unordered gives us the following figures:
OPT          SEQ SCAT PAR        DIR
batch_rowid  37	  0     0         23
batch        36	  0     0         23
nprefetch    36	  0     0         23
and the case 2, unordered then ordered:
OPT          SEQ SCAT PAR
batch_rowid  22	  0     5         23
batch        8    0    16         23
prefetch     34	  0    25         23
As we can see, the behavior is completely different in both cases for all 3 implementations, which means that the specific choice of a nested join method is heavily affected by what Oracle is seeing in the run-time. When a nested loop starts, Oracle is monitoring how often it has to jump from block to block when retrieving rows from the inner table, and depending on that, decides whether or not multiblock reads need to be used.
So in the first case, Oracle starts with ordered data, and doesn’t see any need for multiblock optimizations. Later on, the data becomes unordered, but that doesn’t matter — the decision has already been taken, and is not going to be reconsidered on the fly!
Parameters
There is a number of (mostly hidden) parameters that affect the nested loop behavior. I won’t cover those that enable or disable specific implementations (those are covered elsewhere, e.g. in Randolph’s mini-series), but there are some others that are of interest.
First of all, it’s _table_lookup_prefetch_thresh and _table_lookup_prefetch_size. As the names suggest, they control the threshold for enabling the behavior, and the maximum size of a single multiblock read (i.e. MBRC), correspondingly. By setting _table_lookup_prefetch_thresh to a very high number the prefetch can be effectively disabled, or inversely, by setting it to 0 we can make sure that multiblock reads would be used whenever possible, even for very ordered data sets (low clustering factor).
This can be illustrated by the plot below, which compares the default behavior with _table_lookup_prefetch_thresh = 0 and _table_lookup_prefetch_size = 128:
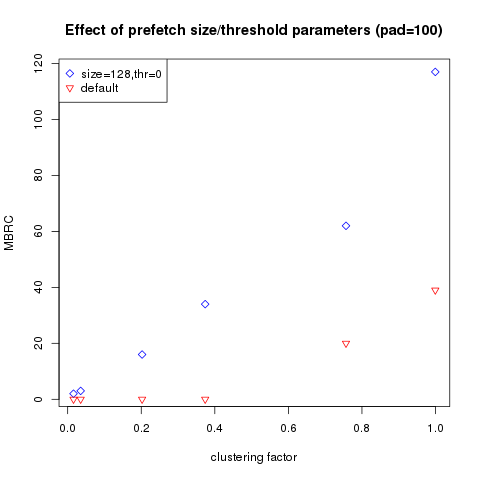
As you can see, with the parameters changed, we can make Oracle use multiblock reads much more aggressively (note that you’d need to set db_file_multiblock_read_count to a higher value than _table_lookup_prefetch_size). Interestingly, _db_file_noncontig_mblock_read_count parameter which should control MBRC for non-contiguous reads (i.e. db file parallel read) doesn’t seem to be relevant here.
Other parameters that could also be of interest here are _disable_index_block_prefetching and _index_prefetch_factor, which I would expect to control prefetch of index blocks — but I didn’t bother to verify this with testing.
Summary
Thanks to our little experiments, we learned the following things:
1) Prefetch behavior is greatly affected by the value of clustering factor in optimizer statistics, the other two nested loop implementations don’t exhibit this behavior
2) Some information regarding prefetch behavior appears to be stored in the shared pool with the rest of the cursor information. This would explain why when changing the value of the clustering factor (without actually changing the data), prefetch behavior only changes if the shared pool is flushed. So this behavior has “memory”, which can be reset by flushing the shared pool
3) All nested loop implementations, including prefetch, depend on the factual ordering of data in the inner table in the beginning of the nested loop. If we start with ordered data, Oracle is unlikely to use multiblock for the rest of the query, if we start with ordered data, use of multiblock reads is much more likely
4) _table_lookup_prefetch_thresh and _table_lookup_prefetch_size parameters can alter the default prefetch behavior and make the use of multiblock reads more aggresive

Николай, добрый день!
Нельзя ли ваш основной текст сделать более ярким,
сейчас он затемнен и мне со своим слабым зрением
приходиться сильно его напрегать.
Спасибо за Ваш интересный и очень полезный блог.
С уважением, Сергей Колесов, Россия, Вологда.
Сергей,
спасибо за отзыв и за интерес к моему блогу! К сожалению, я слабо разбираюсь в настройках WordPress, и с трудом представляю, как можно было бы что-то сделать с яркостью текста – разве что сменить тему оформления полностью (но и в этом случае разные темы могут выглядеть по-разному на разных машинах).
2All — Sergey has brought to my attention that the text in my blog is hard to read because its not bright enough compared to the background. Does anyone else have the same issue and/or know how to make the text easier to read in WordPress? Any particular schemes that might be good from that standpoint?
Thanks!
Yes I feel the text is not bright enough too
Thanks for the feedback. Hopefully this theme should work better for you.