Yesterday, I posted a trace file that seemed odd to me Twitter. This resulted in a very lively discussion, and several very interesting theories were put forward. Even though the issue hasn’t been solved yet, I would like to post a summary of this discussion (plus my findings) so that more people would be able to give their inputs. Also, some of the theories put forward to explain the observed anomaly are very interesting on their own.
The issue is very simple (which I think is one of the reasons why it resulted in such a heated debate). It has to do with unreasonably high CPU utilization with low values of the db_file_multiblock_read_count (from that point on, MBRC) parameter. Here is the setup I used in my tests:
1) 11.2.0.1 Oracle database on a quad-core Windows 7 machine with 8GB of memory
2) A locally management tablespace with uniform 1M extents. I started off with automatic segment space management, then switched to manual to make sure it’s not an ASSM glitch (it wasn’t), so either type is fine
3) In this tablespace, I created a table with 1M rows, with just two columns — numeric “id” and 1000 byte “padding” (to make sure that enough blocks are filled):
create table t tablespace test_fts
as
with gen as (select null from dual connect by level <= 1e5)
select rownum id, rpad('x', 1000, 'x') padding
from gen g1,
     gen g2
where rownum <= 1e6;
This produces a table of about 1.1-1.2 GB in size, neatly packed into 1M extents. Then I simply counted rows to induce a full tablescan (since there are no indexes defined, tablescan is the only option) for several different values of db_file_multiblock_read_count to find the optimal one (flushing buffer cache in between test runs to remove caching effects).
When I started with MBRC values of 1 and 2 (not that I expected any good results here, I was just curious) I noticed that CPU usage was unusually high: 7 seconds (as compared to 22 second execution time). It’s not unreasonable to see some CPU time during full tablescans, as it involves many activities that keep CPUs busy (acquiring/releasing latches, walking hash chains, pinning buffers, copying memory etc.). However, one third of total time seemed like a lot, considering that it was just an uncompressed unencrypted table with only 2 rows, and the query didn’t work any computationally intensive expressions.
That’s why I posted that plan below appeared odd to me and I decided to seek advice on it on Twitter.
select count(*)
from
 t3


call     count       cpu    elapsed       disk      query    current        rows
------- ------  -------- ---------- ---------- ---------- ----------  ----------
Parse        1      0.00       0.00          0          0          0           0
Execute      1      0.00       0.00          0          0          0           0
Fetch        2      7.39      19.37     142860     142973          0           1
------- ------  -------- ---------- ---------- ---------- ----------  ----------
total        4      7.39      19.37     142860     142973          0           1

Misses in library cache during parse: 0
Optimizer mode: ALL_ROWS
Parsing user id: 85

Rows     Row Source Operation
-------  ---------------------------------------------------
      1  SORT AGGREGATE (cr=142973 pr=142860 pw=0 time=0 us)
1000000   TABLE ACCESS FULL T3 (cr=142973 pr=142860 pw=0 time=20144866 us cost=79430 size=0 card=1000000)


Elapsed times include waiting on following events:
  Event waited on                             Times   Max. Wait  Total Waited
  ----------------------------------------   Waited  ----------  ------------
  SQL*Net message to client                       2        0.00          0.00
  Disk file operations I/O                        1        0.00          0.00
  db file sequential read                         4        0.01          0.02
  db file scattered read                      71428        0.13         14.26
  SQL*Net message from client                     2        0.00          0.00
********************************************************************************
I also noticed CPU time decreases as MBRC grows. This could be clearly seen when looking at plotted results for all MBRCs:
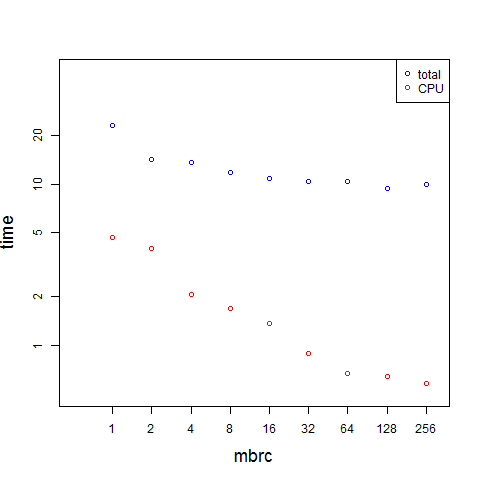
That’s also somewhat counter-intuitive. If the amount of information we put into memory remains the same, why would the CPU time necessary to process it, depend on MBRC?
Several very interesting points were made in the discussion that followed. For the sake of compactness, I’m going to summarize them in form of a table.
| Author | Theory | Counter-arguments |
|---|---|---|
| Jonathan Lewis, Frits Hoogland | problems of measuring asynchronous direct path reads time | The problem persisted after setting disk_async_io. Switching to buffered reads also didn’t make much difference |
| Jonathan Lewis | latching | Doesn’t explain why CPU decreases as MBRC grows |
| Jonathan Lewis | constant cost per creating a multi-block objects in buffer cache | Makes sense, but how can one test to confirm? |
| Cary Millsap | CPU spent on SORT AGGREGATE, rowsource stats are wrong | Why would the cost of SORT AGGREGATE depend on MBRC? Also, improving rowsource sampling frequency didn’t make any difference |
| Cary Millsap, Franck Pachot | overhead from handling blocks etc. | Without flushing buffer cache, the query completed less than in 7 seconds, so it’s unlikely for this overhead to be this big |
| Timur Akhmadeev | Windows time accounting glitch | Similar results were obtained on Linux |
I think that one of the factors that is important for understanding what is going on is that compared to other databases I used for similar testing, this particular database has relatively fast physical reads (even when MBRC is much smaller than the optimal values!), probably because of some hardware optimizations (e.g. read-ahead). Because of that, various CPU overhead on top of physical I/O are becoming more noticeable. But that alone is not sufficient to explain anything.
I’m planning to run more tests to look at latching effects, and also to try and profile the CPU activity, and I’m going to post my results if I find anything. If anyone has any ideas that could shed light on this behavior, please share them, I’d be very much interested to know.

Hi, if you have reproduced this on linux, is that a Linux version with a kernel recent enough for ‘perf’? I think perf got into the kernel at 2.6.21. Essentially if you have Oracle Linux and a UEK kernel, you should have perf. If you want to use perf to measure where the time was spend, also be aware that if you are using virtualisation, the VM should be able to get to the CPUs performance registers. That all is alright, run perf record -g -p , then execute the query, and stop perf once it has executed. This results in a perf.data file, which can show the measured (sampled) consolidated stack traces, with the function most occurring during profiling on top.
Hi Frits,
yes, that’s an OEL machine (kernel version 2.6.39) and it does have perf and actually I even tried to do the CPU profiling using “perf record -F 99 -p “, but for some reason the produced data file didn’t contain any samples (even though it was relatively big, over 0.6MB).
Is it virtualised?
try: perf record -g -p
-g is important for getting consolidated stack traces in the report.
Yes,
it’s a 12-core virtual machine which is provided to end users (like myself) via a VM-cloud with a webUI (so I don’t really have full control over it — I do, however, have root access).
I’ll try appending “-g -p” to “perf record” tomorrow, will let you know how it goes.
Thanks for your help!
Please mind most virtualisation software needs explicit settings for enabling a VM to grab the performance counters from the CPU (PMU events). Certainly vmware has it disabled by default. This might very well be reason you get no output.
You can set perf to use a software counter, however this is depended on O/S scheduling, which can taint your measurements (I’ve described this on my blog).
I think you’re going to find whether the MBRC value affects the sort CPU consumption and, if so, why in the 10032 and 10033 trace information. The symptom you’re experiencing reminds me vaguely of a phenomenon called Bélády’s Anomaly.
Cary,
I replaced count(*) with NULL to get rid of the SORT AGGREGATE and I still saw high CPU usage (although things got a bit messier because of tons of SQL*Net message events, which is why I used measurements with count(*) in my blog). So I don’t think that sort tracing is the most promising approach at this moment. If other theories don’t work out, I will revisit it later.
Best regards,
Nikolay
Looks like I had the same idea Frits had :-)
Tested MBRC 128 vs 4, elapsed time is aprox 2secs vs 7/8, table is 72k blocks
I used syntax “perf record -p <> -o <> -T -g
I picked up the first few functions from the top “consumer” in the run with MBRC 4 and compared them with the 128 run, the first column is the sample count from each run
83 [.] kcbgtcr
18 [.] kcbgtcr
83 [.] kcbz_find_table_scan_read_buffer
3 [.] kcbz_find_table_scan_read_buffer
76 [.] kcbzgm
92 [.] kcbzgm
40 [.] kcbzibmlt
10 [.] kcbzibmlt
kcbgtcr is Kernel Cache Buffer Get Consistent Read
kcbz_find_table_scan_read_buffer is related to “cache table scan” latch
kcbzgm is related to “cache buffers lru chain” latch
kcbzibmlt is related to “cache buffers chains” latch
Hope it helps!
Thanks for sharing your results.
How much time was spent in your case on CPU compared to total time?
I’ll try your perf syntax tomorrow, but I’m afraid something may be missing in my setup (like some permissions maybe). I’m in the process of moving from Solaris to Linux so I’m just getting started with Linux performance instrumentation…
For the 2 secs run, 1.17 secs
For the 8 secs run, 3.55 secs
Look at it the other way around – the CPU is a large fraction of the total time because the elapsed time is very low. You’ve managed to do 71,000 “physical read requests” in 19.37 seconds, which is 3,600 I/Os per second, which is about 20 times as fast as you might expect from a fast disc.
Your CPU is only 1.5% of the total time that “real” disk reads would produce.
Jonathan,
that’s a very good point. I too mentioned something like this towards the end of the post. And this point brings us to the next question: do 200 us “physical read requests” represent an actual reality, or it is an artifact of testing? I think the answer to this question is less obvious than it may seem at the first sight.
Most of us are used to io wait events in the millisecond range and submillisecond waits seem to be “cheats”. If it’s 200 us, then it’s not a real physical read, it’s just OS (or h/w) cache fooling us!
I don’t think this is necessarily true, and I think it has a tendency to become even less true with time. Not only because low-latency SSD disks are becoming more and more common, but also because there are more and more h/w optimization techniques that render the naive interpretation of physical io events invalid.
Let’s take my test setup as an example. Yes, 200 us per physical io does seem to good to be true, but it’s not disk cache fooling us (it’s only 64MB big, while the table is over 1GB). Look at it another way: it means that the disk is reading data 80MB/s, which is pretty ordinary data transfer speed these days. Most likely, behind the scenes the I/O requests are somehow batched together (I think that 64kB requests are standard for Windows, but I’m not entirely sure), but so what? It’s a part of the hardware reality that we’re dealing with.
Many production databases I’ve worked with have long-term averages for “db file sequential read” and/or “db file scattered read” in hundreds of microseconds or even lower. I’ve always written off this to external caching effects, but now I’m not so sure anymore — it could be any number of low-level I/O optimizations producing those numbers.
The important thing is that those numbers still represent a reality, i.e. they tell us something about how fast we can read X bytes of data from the database in a certain way.
Hi,
May be for an OS reason ? Disk swapping or OS cache management. On windows, please check the advanced system proprerty (right click on computer, advanced setting… Select performance for services and not performance for programs.
See this french screenshot :
[image: Images intégrées 2]
Otherwise, a latch activity overhead. A little time to put one block on the DB cache, the same time for two or four… blocks ? The CPU curve is almost a straight line…
Regards
Hugues
Thanks Hugues,
I think that memory problems (paging) could have looked similar, but I’m pretty sure that there was enough physical memory on the system at that time. I’m not sure how to check the OS cache management theory — any specifics? Unfortunately, your screenshot did not get attached.
Latch activity overhead does sound plausible (especially given Mauro’s findings). I’d like to understand more why the amount of work to put N blocks on the buffer cache stays nearly independent of N. Jonathan Lewis mentioned multiblock objects on the buffer cache…
Hi, I would ask you the following 2 questions.
1) for my understanding with a higher MBRC the underlying OS can read the same amount of Oracle data block with fewer OS call. This should reduce the CPU time. So I would count this expected behaviour.
2) In your post I mentioned the version 11.2.0.1 . Could you reproduce this issue with a current patch set too ?
Regards, Silvio
Hi Silvio,
I agree with this logic, but I’m still surprised that:
a) the overhead is as big as that
b) there such a dramatic difference between CPU overhead when doing physical reads and CPU time spent on reading same amount of data from buffer cache.
2) yes, the basic behavior is same for 11.2.0.3 and 11.2.0.4. the details will vary depending on many factors (e.g. disk performance and configuration).
Best regards,
Nikolay
please mind 11.2.0.1 is particularly bad from the adaptive number of IOs oracle chooses, since it stays at 2 IOs (there’s an error in the database code which makes certain measurements 0, which oracle uses to calculate if it needs to scale up), whilst newer versions do actually scale up.