Nowadays, data in databases is wrapped in may layers of cache: result cache, buffer cache, OS page cache, storage hardware cache… They greatly improve performance, but they also make it less stable and harder to predict. And when I/O performance takes a turn for worse, one has to go through multiple layers of cache trying to understand what went wrong and why. I had such a case not too long ago.
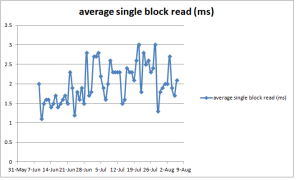
The incident took place on an Oracle 11.2.0.3 database running on a Solaris 10 server. The first symptom was decreased throughput of one of batch processes in the database by about 30 percent. Since the process was spending more than half of its time doing I/O (as ASH indicated), it was easy to establish that the slowdown was linked to increased time of db file sequential reads by plotting average wait times from DBA_HIST_SYSTEM_EVENT (the SQL code for this and other queries in this blog post can be found below, in the Appendix):
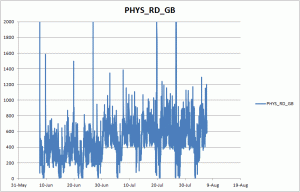
I also plotted the I/O volumes using DBA_HIST_IOSTAT_DETAIL view and found a very distinct step-like increase:
So at some point the database started to read about 200Gb more data per 30 min snapshot, or almost twice as much as before. Interestingly enough, in the middle of the problem period storage specialists closely examined the I/O stats and didn’t find any queuing, increase in I/O volumes or anything out of ordinary — how come?
Apparently, many of what the database perceives as physical reads, weren’t really physical. Those requests never reached storage, so the didn’t affect its stats. Instead, they were either serviced by the storage cache or the OS page cache. I had worked with this database before so I knew that it was the OS page cache it was dependent on (but if I hadn’t known, this is something that can be determined from read time histograms as described in Kyle Hailey’s post here).
This explained, why such a dramatic change escaped being noticed for so long, even though dozens of AWR and ASH reports were generated and studied by at least half a dozen of different specialists. Since reads from the page cache are very fast, they are only responsible for a small part of database time, and thus the activity that was producing them was almost invisible to ASH. It could have showed up in the “SQL ordered by physical reads” section of AWR reports, but they are not always reliable (e.g. if bind variables are not used splitting resource usage stats between different sql_id’s).
While very small in terms of DB time, this activity was very impactful on the rest of database processes, as it was robbing them of the page cache, reducing overall database performance quite considerably.
To identify the source of additional reads, I queried at DBA_HIST_SQLSTAT grouping by “module”, while choosing very long periods (1 week before the change, 1 week after) to eliminate all random noise. I found one of the database modules suddenly became x20 more active. Moreover, as I found running a similar query with grouping on “force_matching_signature”, most of this increase in activity was due to a single SQL statement run a few times per hour, and yet this SQL statement never came to a DBA’s attention before as it was never seen in AWR top-SQL charts!
And as it often happens, there wasn’t even need for this SQL statement to run as frequently as it did, and it didn’t even have to run on that particular database at all (as there was a reporting database whose data quality was sufficient for the purposes of that particular report). It was only set up this way because no one thought it mattered. So once identified, the problem was extremely easy to fix.
Opposite caching patterns
One curious thing about this problem is why the two caching layers (database and OS) behaved so differently here: almost exactly 100% efficiency on the OS side, and almost exactly 0% in the database. After all, aren’t all cached supposed to be based on the same principle — the more frequently the data is used, the better it’s cached?
But database buffer cache does not operate based exclusively on how “hot” data is. There are also such factors as:
– block size (non-stadard block size means a separate, probably much smaller, buffer cache pool)
– explicit buffer pool binding (e.g. a table defined as BUFFER_POOL RECYCLE)
– direct reads (that bypass buffer cache altogether)
– full scans that place the data on the cold end of LRU list (unless the table is defined as CACHE).
In this particular case, all of the listed factors played a role.
Summary
– leaving much free memory to OS to use as page cache has nasty side effects (such as problems controlling and monitoring it, and increased I/O volatility). Every effort should be made to give this memory directly to Oracle
– when analyzing I/O data it’s important to keep in mind that what the database calls physical I/O isn’t always physical
– making lots of physical I/O does not equal waiting much time on I/O-related waits, so top I/O consumers can be invisible in ASH
– not using binds is bad even when parsing is not an issue, because this makes the SQL invisible for monitoring tools; a work around is to aggregate SQL stats over force_matching_signature or module, but it isn’t always a suitable solution. It’s much better to use binds, unless you really need to optimizer to re-optimize the plan on every execution
– AWR is most informative when the period taken is commensurate with the duration of the problem. For short-lived problem, 1 snapshot is optimal, but for problems that span weeks, a weekly report may be more helpful, as it averages out all small fluctuations. The same is true about queries on AWR views.
Appendix: used queries
select /* average event duration vs time */
       time,
       round(time_delta/1e3/nullif(waits_delta,0), 1) avg_wait_ms,
       waits_delta num_of_waits,
       round(time_delta/1e6) total_seconds
from
(
  select sn.snap_id,
         sn.begin_interval_time time,
         e.total_waits - lag(e.total_waits) over (partition by e.event_name order by e.snap_id) waits_delta,
         e.time_waited_micro - lag(e.time_waited_micro) OVER (PARTITION BY e.event_name ORDER BY e.snap_id) time_delta
  from dba_hist_system_event e,
       dba_hist_snapshot sn
  where e.snap_id = sn.snap_id
  AND e.event_name = :event
) ev
order by time desc

select /* physical I/O (bytes) vs time */*
from
(
  select to_char(time, 'dd-mm-yy hh24:mi') time,
         cast(time as date) - to_date('30-dec-1899', 'dd-mon-yyyy') excel_time, -- for plotting in Excel
         (phys_read - lag(phys_read) over (order by time))/1024/1024/1024 phys_read_gb,
         (phys_write - lag(phys_write) over (order by time))/1024/1024/10214 phys_write_gb
  from
  (
    select sn.begin_interval_time time,
          sum(case when ss.stat_name = 'physical read total bytes' then value else 0 end) phys_read,
          sum(case when ss.stat_name = 'physical write total bytes' then value else 0 end) phys_write
    from dba_hist_snapshot sn,
        dba_hist_sysstat ss
    where ss.snap_id = sn.snap_id
    and ss.stat_name in
    (
      'physical read total bytes',
      'physical write total bytes'
    )
    group by sn.begin_interval_time
  )
)
where phys_read_gb > 0 -- remove bogus negative values due to instance restarts
order by excel_time desc;

select /* breakdown of physical reads by module */
     module,
     sum(disk_reads_delta) phys_reads,
     100*sum(disk_reads_delta)/sum(sum(disk_reads_delta))over() pct_total_captured
from dba_hist_sqlstat ss,
    dba_hist_snapshot sn
where ss.snap_id = sn.snap_id
and sn.begin_interval_time between :start_date and :end_date
group by module
order by sum(disk_reads_delta) desc;

select /* breakdown of physical reads by force_matching_signature */
      force_matching_signature,
      100*sum(disk_reads_delta)/sum(sum(disk_reads_delta))over() pct_total_captured
from dba_hist_sqlstat ss,
    dba_hist_snapshot sn
where ss.snap_id = sn.snap_id
and sn.begin_interval_time between :start_date and end_date
group by force_matching_signature
order by sum(disk_reads_delta) desc;

