Everyone who is regularly dealing with performance issues is probably familiar with this question: at what point does being proactive turns into obsession about every harmless little anomaly? Where do you draw the line? It’s a difficult question and there’s no obvious answer, at least none that I’m aware of. I’m facing this dilemma on almost a daily basis, including this little story that I’m about to share in this post.
It’s started off as a mere blip on some graphs.
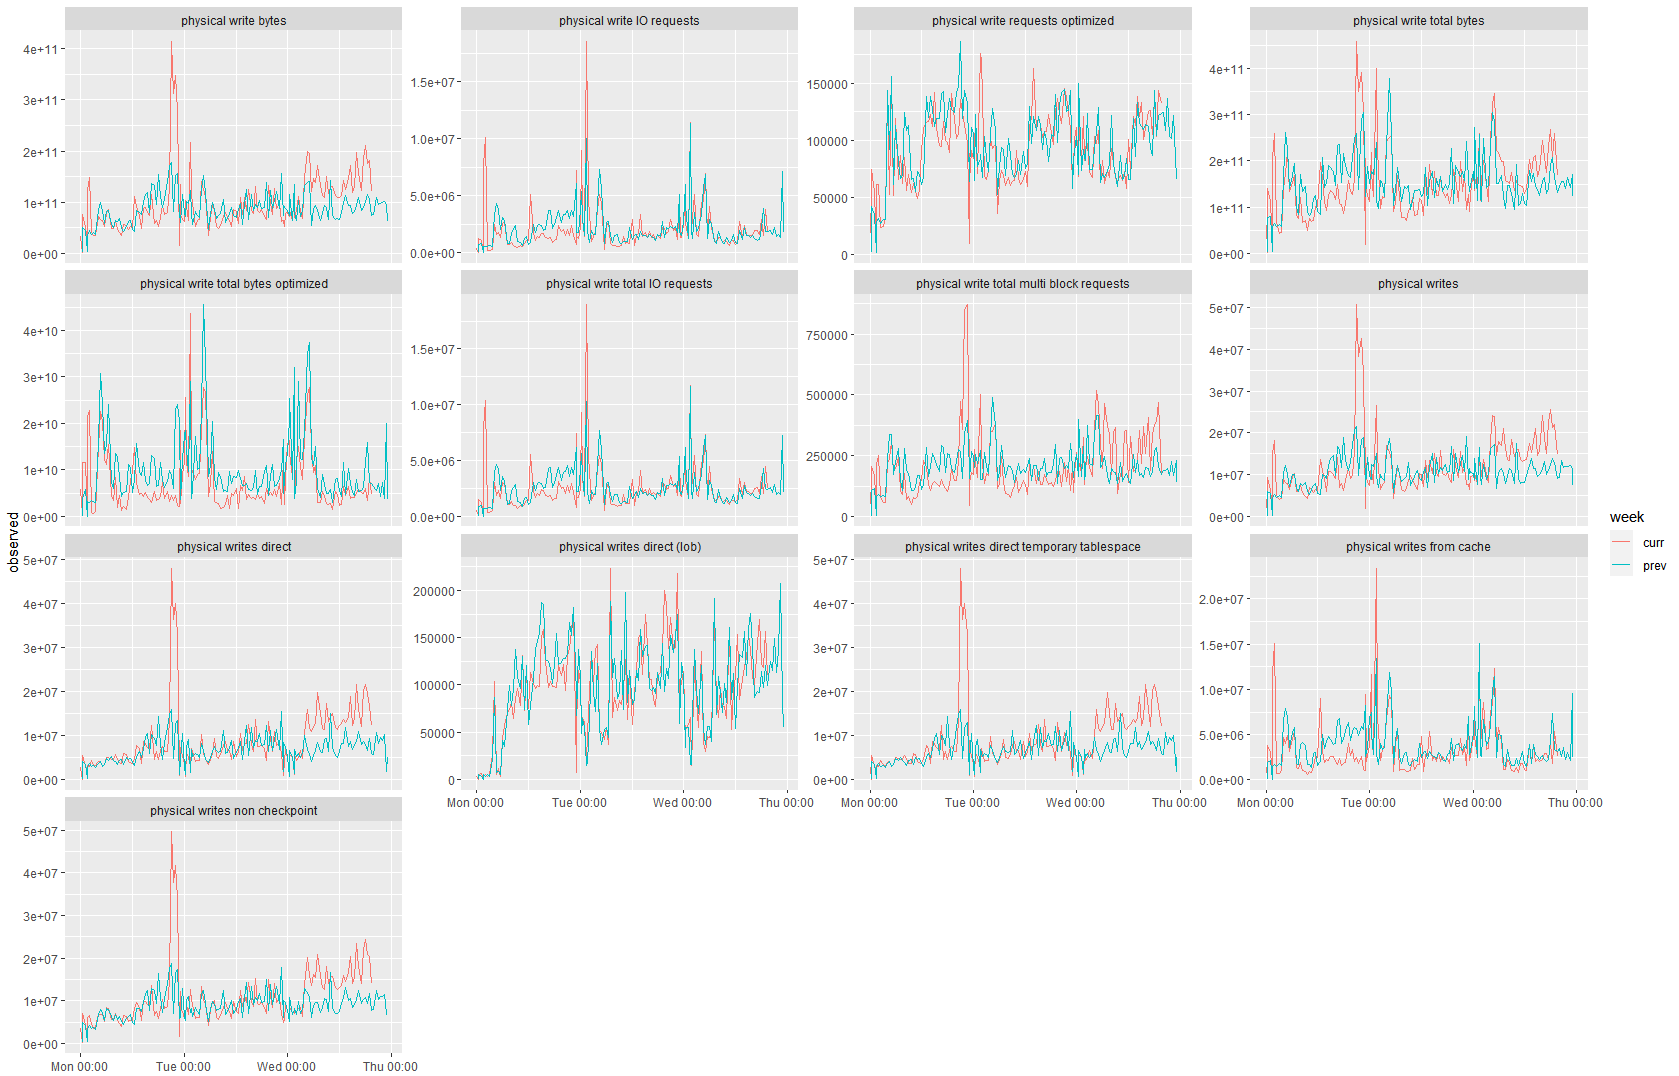
As you can see, at a certain moment in time the red line (current week’s metrics) raises above the blue one (previous week) for physical writes in general, and in particular for non-LOB direct writes. The change didn’t look huge though. So was it worthwhile to do anything about it, or was it just some semi-random noise?
To decide this, I looked at iostat write latency (W_AWAIT). If something is only affecting some counters, that’s one thing, but when actual response times are affected, it’s best to act fast even when there is no evidence of business impact.

Fortunately, there wasn’t much to do, since I have my ashviewer tool that allows to visualise ASH data, including read/write I/O metrics for active sessions with option of breaking down by any ASH variable.
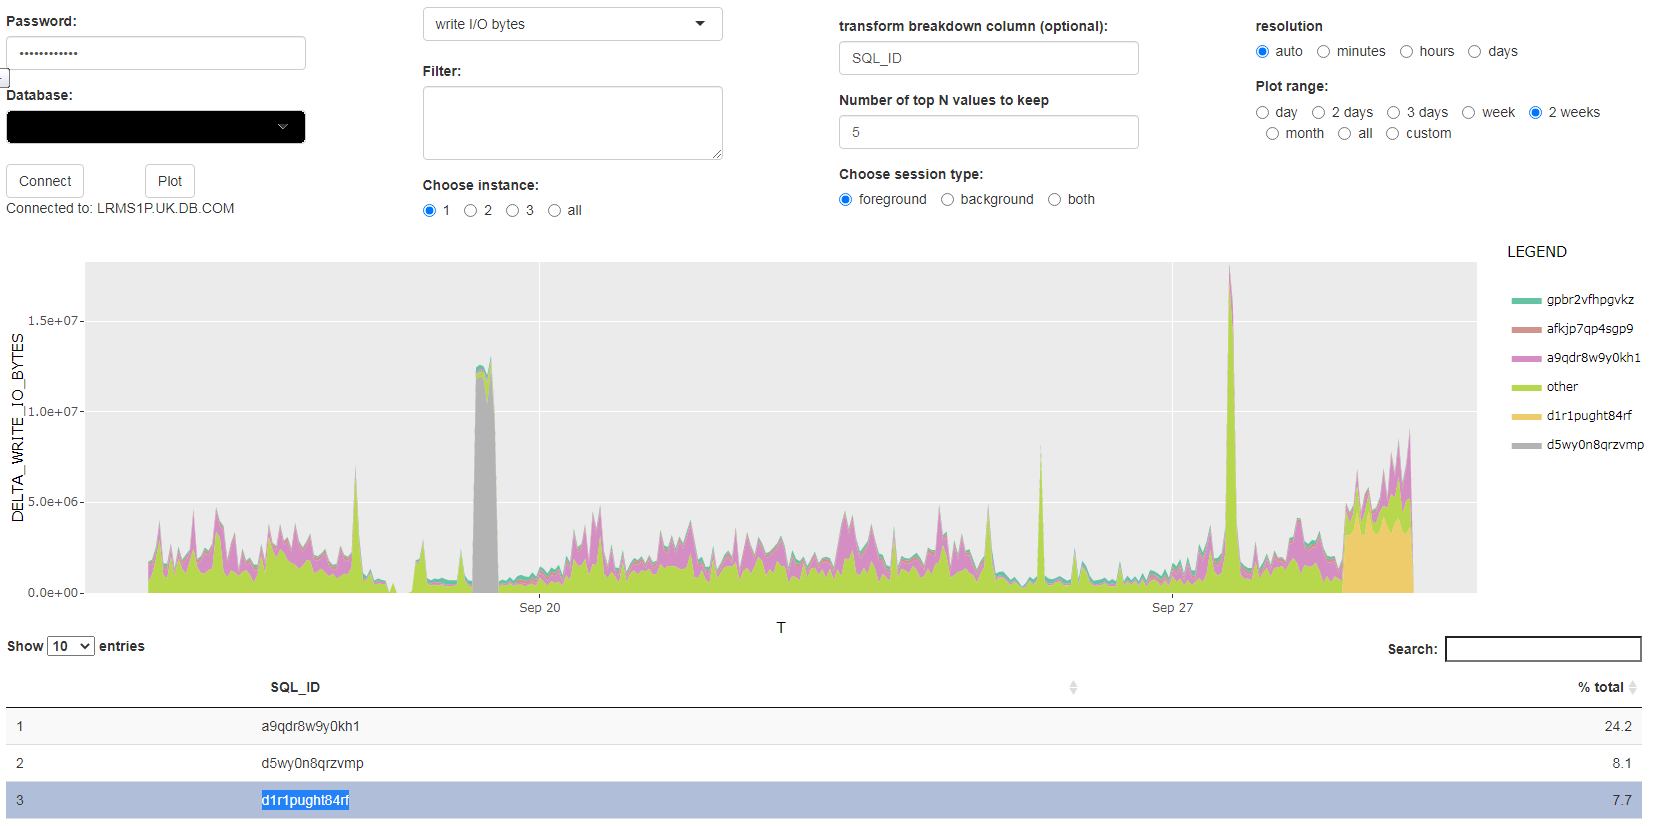
When I choose breakdown by write I/O bytes and a sufficiently large date range, I can immediately see that the increase in write I/O is associated with sql_id = d1r1pught84rf, which according to DBA_HIST_SQLTEXT and DBA_HIST_SQLSTAT was a query by the Enterprise Manager agent:
WITH blocked_resources AS(
    SELECT
        id1,
        id2,
        SUM(ctime)AS blocked_secs,
        COUNT(1)AS blocked_count,
        type
    FROM
        v$lock
    WHERE
        request > 0
    GROUP BY
        type,
        id1,
        id2
),blockers AS(
    SELECT
        l.id1,
        l.id2,
        l.type,
        l.sid,
        br.blocked_secs,
        br.blocked_count
    FROM
        v$lock              l,
        blocked_resources   br
    WHERE
        br.type = l.type
       AND br.id1 = l.id1
        AND br.id2 = l.id2
        AND l.lmode > 0
        AND l.block <> 0
)
SELECT
/*+
MERGE(@"SEL$22")
MERGE(@"SEL$109DB78D")
MERGE(@"SEL$5")
MERGE(@"SEL$38")
MERGE(@"SEL$470E2127")
MERGE(@"SEL$7286615E")
MERGE(@"SEL$62725911")
MERGE(@"SEL$2EC965E0")
MERGE(@"SEL$C8360722")
MERGE(@"SEL$874CA85A")
MERGE(@"SEL$74A24351")
MERGE(@"SEL$71D7A081")
MERGE(@"SEL$7")
MERGE(@"SEL$24")
CARDINALITY(@"SEL$AF73C875" "S"@"SEL$4" 1000)
CARDINALITY(@"SEL$AF73C875" "R"@"SEL$4" 1000)
*/
    b.id1
    || '_'
    || b.id2
    || '_'
    || s.sid
    || '_'
    || s.serial# AS id,
    'SID,SERIAL:'
    || s.sid
    || ','
    || s.serial#
    || ',LOCK_TYPE:'
    || b.type
    || ',PROGRAM:'
    || s.program
    || ',MODULE:'
    || s.module
    || ',ACTION:'
    || s.action
    || ',MACHINE:'
    || s.machine
    || ',OSUSER:'
    || s.osuser
    || ',USERNAME:'
    || s.username AS info,
    b.blocked_secs,
    b.blocked_count
FROM
    v$session   s,
    blockers    b
WHERE
    b.sid = s.sid
As we can see, the query has a bunch of hints hardcoded into it which are supposed to ensure its plan stability. However, it looks like for some reason they don’t really work the way they were supposed to:
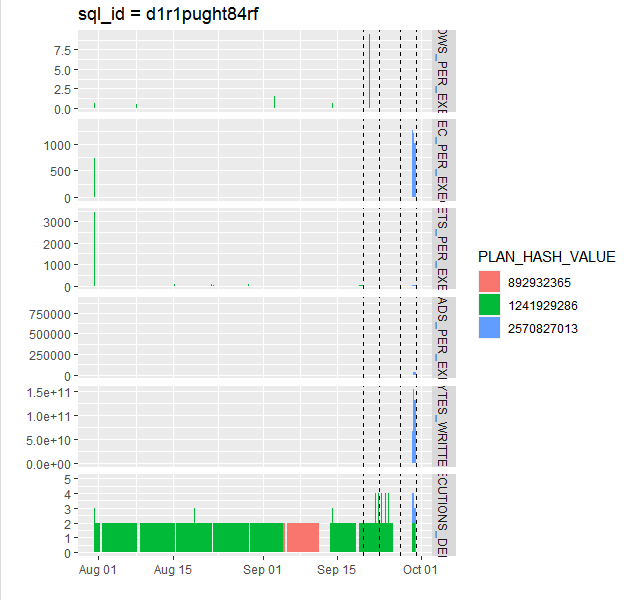
Based on that graph, excessive write activity was associated with the bad plan 2570827013, and reverting to either of earlier plans, 892932365 or 1241929286, should have resolve the issue. So that’s what I asked the production DBA to do, and that took care of that little problem, and write metrics went back to normal.
And we all lived happily ever after for entire two or three days, until another issue came along (hopefully to be described in another blog post soon enough).

Excellent.
Very Informative